Sales Metrics: What to Track at Every Stage of the Funnel
The sales metrics that drive revenue decisions — from pipeline coverage and win rates to quota attainment and commission accuracy. A practical guide for sales ops.
Most sales teams track more metrics than they act on. The average sales dashboard has 15-25 numbers on it. Two or three of them actually drive decisions.
The problem isn't measurement — it's knowing which metrics connect to which decisions. Pipeline metrics tell you where revenue will come from. Activity metrics tell you why it's moving or stalling. Compensation metrics tell you whether your comp plan is actually working.
This guide covers the metrics that matter at each stage of the funnel, including the ones most sales ops teams neglect: the numbers that reveal whether your commission process is functioning or quietly eroding rep trust.
Leading vs lagging indicators
Before getting into specific metrics, the distinction between leading and lagging indicators is worth stating clearly, because conflating them is the source of most reporting confusion.
Lagging indicators measure outcomes that have already happened: quota attainment, revenue closed, win rate. They're accurate but backward-looking. By the time the number moves, the decisions that caused it are weeks or months in the past.
Leading indicators measure activity and pipeline health before deals close: number of qualified opportunities created, pipeline coverage ratio, days since last customer contact. They're predictive but imperfect — high activity doesn't guarantee revenue.
A functional sales metrics stack needs both. Lagging indicators tell you where you are; leading indicators tell you where you're going.
Top-of-funnel: pipeline metrics
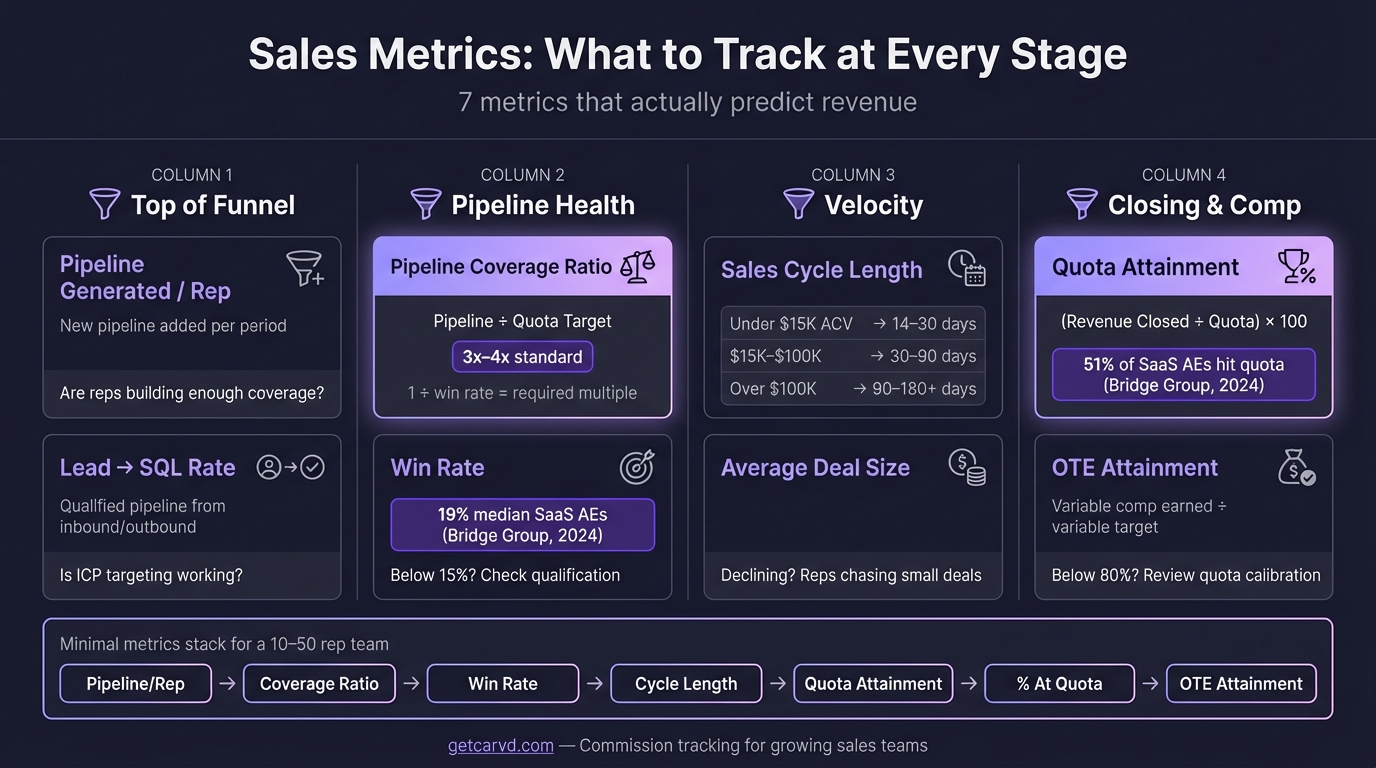
Pipeline coverage ratio
Pipeline coverage is the ratio of your open pipeline value to your quota for the period. The standard benchmark is 3x-4x — $300K-$400K in pipeline for a $100K quarterly quota. Enterprise teams targeting longer deal cycles typically need 4x-6x coverage because lower win rates and longer timelines mean more deals fall out before close.
Coverage below 3x is a warning sign. It means reps either need to create more pipeline or management needs to reset quota expectations. Both are important to know before quarter-end, not after.
Average deal size
Average deal size tells you what kind of buyers your pipeline attracts. It matters for commission planning because deal size distribution affects payout variance — a team with a few massive deals and many small ones will have wildly variable monthly commission expenses compared to a team with consistent deal sizes.
Track it over time. Shrinking average deal size often reflects competitive pressure or a drift downmarket that isn't visible in revenue totals until several quarters in.
Pipeline creation rate
How many new qualified opportunities are created per rep per week or month. This is the leading indicator for whether coverage will hold. A team with strong pipeline coverage today but low creation rate will see that coverage erode over the next 60-90 days.
Mid-funnel: conversion and velocity metrics
Win rate
Win rate is the percentage of qualified opportunities that close as won. According to the Bridge Group's 2024 SaaS AE Metrics & Compensation Benchmark Report, the median win rate for SaaS AEs is 19% — down from 23% in 2022. Win rates above 25% are strong for mid-market SaaS; enterprise teams typically land between 15-20%.
A declining win rate with stable pipeline creation means the issue is competitive positioning or deal qualification, not prospecting. That's a different fix than declining pipeline.
Sales cycle length
How long it takes an opportunity to move from qualified to closed. According to the Ebsta 2023 B2B Sales Benchmark Report, which analyzed over 3 million deals, sales cycles are 22% longer than they were in 2022. For commission planning, longer cycles mean higher plan costs in the period deals close — a budget variance that's easier to model if you're tracking cycle length proactively.
Stage conversion rates
What percentage of opportunities progress from each stage to the next. If deals are stalling at proposal, that's a pricing or ROI problem. If they're stalling at legal, that's a process problem. Stage conversion data tells you which part of the funnel to fix before the end-of-quarter fire drill.
Bottom-of-funnel: performance metrics
Quota attainment
Quota attainment is the percentage of a rep's target that they've achieved. It's the most-tracked sales metric and, on its own, one of the least useful — it tells you where a rep landed, not why.
The more important version is the attainment distribution: what percentage of reps hit 100%+ of quota, what percentage hit 70-99%, and what percentage hit below 70%. Salesforce's 2024 State of Sales report, based on a survey of 5,500 sales professionals, found that 84% of reps missed quota in the prior year. Fewer than half of reps hitting quota is now the norm across the industry.
That distribution matters for comp plan design. If most of your reps are landing at 80-85% attainment, that's a quota-setting problem, not a performance problem. If the top 20% of reps are hitting 150%+ while the rest are below 70%, that's a pipeline distribution or territory design problem.
Rep ramp time
How long it takes a new hire to reach full productivity. The Xactly 2024 Sales Compensation Report, which surveyed 230 companies, found that 77% report a ramp period of six months or less for new AEs, with 47% of companies noting that fewer than 90% of new hires make it through the full ramp period.
Ramp time affects commission expense in ways that are often underestimated. Reps in ramp typically have lower quotas or modified commission rates — the financial model needs to account for that headcount being partially productive for the first two quarters.
Revenue per rep
Total revenue generated divided by number of revenue-generating reps. A simple number that captures both quota sizing and headcount efficiency. Tracked over time, it reveals whether the team is getting more or less productive per head — which is the actual answer to whether compensation spend is working.
Commission operations metrics
This is the category most sales dashboards omit entirely. The metrics below measure whether your compensation process is functioning — not just whether revenue is coming in.
Commission accuracy rate
The percentage of commission calculations that are correct without requiring adjustment after initial processing. An error in a commission run isn't just an ops problem — it's a trust problem. Reps who receive incorrect statements run their own calculations, dispute the difference, and disengage from company-provided numbers.
A commission accuracy rate below 95% is a sign of a process issue worth diagnosing. Common causes: manual data entry into spreadsheets, overlapping or ambiguous plan rules, or deal crediting that isn't tied to a single system of record. Switching to a structured CSV deal import process eliminates the manual entry errors that are the most common root cause.
Time-to-pay
How many days after a period closes before reps receive their commission statement and payment. CaptivateIQ's 2025 Sales Compensation Benchmarks Report found that teams spend approximately 36 hours per payout period on commission processing. Long processing times — more than two weeks after period close — sever the connection between closing a deal and seeing the reward, which reduces the motivational effect of variable comp.
Commission dispute rate
The percentage of commission runs that generate at least one rep dispute. A high dispute rate usually indicates one of three problems: plan complexity that reps can't verify independently, data discrepancies between what reps expect to be credited and what gets calculated, or a lack of deal-level transparency in statements.
Tracking dispute rate over time shows whether process improvements are working. If your rate is flat or rising, the root cause hasn't been addressed.
Shadow accounting rate
Shadow accounting is when reps maintain their own spreadsheets to independently verify their commission calculations. It's difficult to measure directly, but a proxy is how often reps contact sales ops with "can you explain my number" questions — or how much time ops spends answering those questions each period.
High shadow accounting signals low trust in the commission process. The fix is usually transparency — deal-level statements that show exactly how each payout was calculated — not better spreadsheets.
Using metrics together
Individual metrics rarely tell the full story. The combinations are more useful:
High pipeline, low win rate: Too much unqualified pipeline. Either qualification criteria are too loose or reps are inflating pipeline to hit activity targets.
High quota attainment by top reps, low attainment by everyone else: Quotas may be set for top performers rather than median performance. Or territories are inequitably distributed.
Low commission accuracy rate, high dispute rate: The commission process needs a structural fix — probably deal-level transparency through rep dashboards and a move away from manual calculation.
High time-to-pay, high shadow accounting: Reps don't trust a process that takes too long and shows them too little. These two metrics tend to move together.
The metrics worth building a dashboard around
Not every metric needs to be on every dashboard. Create metric dashboards for your board deck — Deckary builds consulting-grade slides. The minimal set that gives a sales leader visibility into the full funnel:
- Pipeline coverage ratio (leading: will quota be hit?)
- Win rate (lagging: is pipeline converting?)
- Quota attainment distribution (lagging: are reps on the right plans?)
- Sales cycle length (leading: when will pipeline convert?)
- Commission accuracy rate (ops: is the comp process working?)
- Time-to-pay (ops: is comp closing the loop with reps?)
For teams using commission software like Carvd, accuracy rate and dispute rate become measurable automatically — Carvd's dispute resolution workflow logs every calculation at the deal level, so discrepancies surface before they become disputes rather than after.
Related reading:
Last updated: March 22, 2026