Sales Territory Planning: Align Territories, Quotas & Commission
Sales territory planning determines which reps own which accounts — and directly affects quota fairness, commission payouts, and attainment. Here's how to do it right.
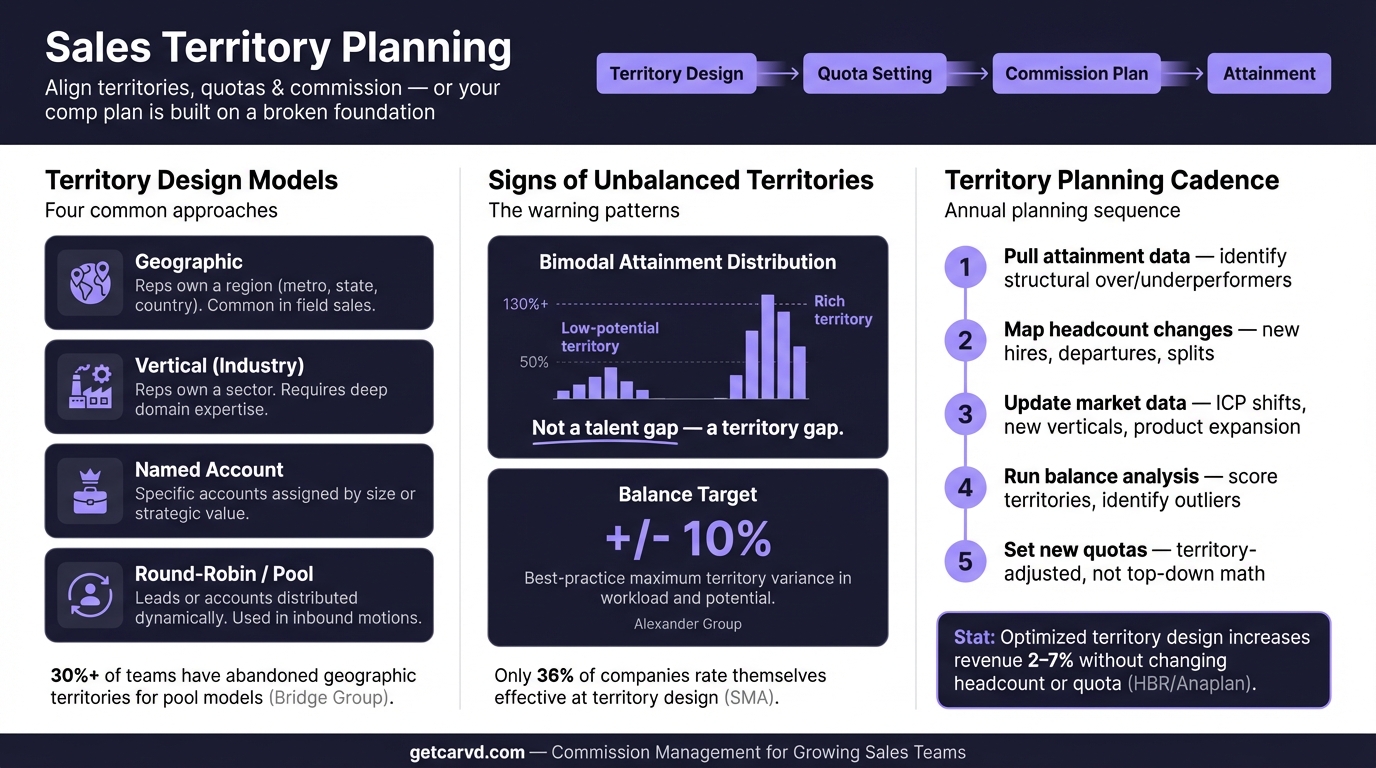
Territory design is one of the least glamorous parts of sales operations — and one of the highest-leverage. How you divide accounts and market segments among reps determines whether quotas are fair, whether commission plans are credible, and whether your top performers stay.
Get it wrong and you end up with one rep drowning in 300 accounts while another coasts on three enterprise renewals. Both will complain. One will leave.
This guide covers how to approach territory planning, how to connect territory design to quota and commission, and what to do when your current setup is producing unequal outcomes.
Why territory design has outsized impact on sales results
The Sales Management Association surveyed 100+ companies ranging from $10M to $10B in revenue and found that only 36% of organizations consider their territory design efforts effective. The other 64% described their approach as ineffective (31%) or only somewhat effective (33%).
The performance gap between those groups is striking. Companies that designed territories effectively achieved 14% higher sales objective attainment than the average. Ineffective territory designers came in 15% below average. That's a roughly 29-point spread in sales performance that traces back to how well accounts were allocated — not rep skill, not market conditions.
Academic research reinforces this. Zoltners and Lorimer's study of 4,800+ territories across 18 companies found that more than half of territories had workloads that deviated by more than 15% from the ideal. In one case, realigning territories doubled the company's sales growth-to-market growth ratio.
Territory imbalances produce predictable problems downstream:
- Reps in over-loaded territories underperform against quota not because they're bad — they're just stretched too thin
- Reps in under-loaded territories hit quota too easily, making the plan look well-designed until a new rep enters and gets the same assignment
- Quotas set against unfair territories fail the quota attainment benchmark — which should land 55-65% of reps at or above target, per Alexander Group data
- Commission calculations become disputed when reps feel their territory put them at a structural disadvantage
The four territory models
Geographic
The most common model — 76% of companies use geography as the primary factor, according to SMA research. Reps own a region: a city, state cluster, or country. Makes the most sense for field sales where in-person proximity and relationship density matter.
The downside: geographic assignment doesn't account for account density or potential. Two states the same size on a map can have ten times the enterprise account concentration in one versus the other.
Vertical / industry-based
Reps own a sector rather than a geography — financial services, healthcare, manufacturing. This builds domain expertise and lets reps speak the language of the industry. Common in teams where enterprise deals require industry credibility.
Trade-off: vertical territories can create knowledge silos and are harder to rebalance as industry growth rates shift.
Named account (account-based)
Specific accounts are assigned to specific reps, usually stratified by size — enterprise accounts to senior reps, mid-market to mid-tier AEs, SMB to early-career reps or pooled coverage. Common in strategic B2B sales where a handful of accounts represent the majority of revenue potential.
This model is the most explicit about opportunity — everyone can see exactly what each rep owns — which makes fairness debates more visible and territory disputes more common.
Hybrid
The majority of larger teams use some combination of the above. A typical setup: geographic regions as the foundation, with named enterprise accounts carved out and assigned regardless of region, and vertical specialists handling specific industry verticals across all regions.
Hybrid models are the most flexible but require the most maintenance. As accounts are won, lost, or reassigned, the carve-outs need regular reconciliation.
How territory connects to quota and commission
Territory planning and quota-setting aren't two separate processes — they're one. The sequence is:
1. Define total addressable opportunity by territory — How much revenue is reasonably available in this account set? This comes from historical close rates applied to the total account pool's TAM estimate.
2. Set quota as a fraction of addressable opportunity — A common benchmark is that quota should require a rep to capture 20-30% of the available opportunity in their territory. Below 20% and the quota will be trivially easy. Above 30% and you're setting up the rep to miss.
3. Set commission rate to produce target OTE at quota — If a rep's variable pay target is $70K and their quota is $700K, the base commission rate is 10%. Use the OTE calculator to verify this math across different territory sizes. This rate only works if the quota number was set fairly against the territory. Model territory revenue targets in a Stackrows sales forecast template.
4. Build in accelerators above quota — Tiered rates above 100% attainment reward overperformance. But accelerators only work as a motivator if the base quota was credible. Reps who believe their territory is underpowered won't stretch for 120% — they'll anchor to 80%.
The connection to commission integrity is direct. When territories are unequal, commission errors compound. A rep who closes the same number of deals as a peer but earns 40% less commission — because their territory was half the opportunity size — has a legitimate grievance. If your commission process can't explain the difference, you have a trust problem.
Tools like Carvd can show each rep exactly how their commission was calculated through rep dashboards — which deals counted, what rates applied, what quota credit was assigned — but the fairness of the underlying territory is a question that has to be answered before commission runs, not during them.
A practical approach to annual territory planning
Most companies redesign territories once per year, per SMA data. Here's a reasonable process:
Step 1: Audit the current state
Pull quota attainment by rep for the prior year, sorted by territory. If attainment distribution is wider than 40 percentage points between the top and bottom quartile of reps, territory imbalance is likely contributing. Also look at:
- Pipeline coverage ratio by territory (pipeline / quota)
- Win rate by territory
- Average deal size by territory
Large variations in these metrics across otherwise similar reps usually point to territory problems, not rep performance problems. Check your rates against the commission rate benchmarks tool to ensure the plan math holds across different territory sizes.
Step 2: Score accounts by opportunity
Assign each account a potential score based on company size, industry, prior spend, and product fit signals. This doesn't have to be sophisticated — a simple tiering system (Tier 1, 2, 3) based on revenue potential works. The goal is to replace map-area intuition with opportunity-weighted data.
Step 3: Balance by potential, not count
A territory with 500 SMB accounts isn't necessarily bigger than one with 20 enterprise accounts. Balance on weighted opportunity, not raw account count. The goal is roughly equal expected revenue per territory — not equal account lists.
Step 4: Account for rep tenure and ramp
New reps shouldn't inherit a territory identical to a 3-year veteran's. Ramp periods compress expected production; territory size can compensate. Build territory-by-rep matching that accounts for how long each rep has been operating in their segment.
Step 5: Communicate changes early
Territory changes have direct income implications. When you realign territories mid-year or at the start of a new fiscal year, reps will immediately calculate what deals they're losing, what they're gaining, and whether their quota changed in proportion. Explain the methodology. Reps who understand how territories were designed accept unfavorable assignments more readily than those who see a black-box change to their income potential.
Signs your territories need rebalancing
- More than 50% of reps consistently missing quota while a minority consistently blows past it — especially when attainment patterns correlate with geography
- High voluntary attrition among mid-performing reps in specific regions
- Pipeline coverage ratio varies by more than 2x across similarly-sized territories
- New hire territory assignments are visibly smaller or larger than equivalent veteran territories
- Reps regularly escalate about account ownership conflicts or territory boundary disputes
Annual redesigns prevent most of these. According to the SMA research, 83% of organizations still rely primarily on spreadsheets for territory planning. That's manageable for simple geographic models with under 20 reps — it becomes error-prone when you're working with named account carve-outs, hybrid models, or quarterly rebalancing.
Putting it together
Territory planning sits upstream of quota-setting, which sits upstream of commission design. Getting the sequence right means sales compensation planning starts from a fair foundation — and the sales KPIs you track reflect real performance differences, not territory lottery outcomes.
The practical test: if two reps with similar experience, similar deal velocity, and similar win rates are landing at substantially different attainment rates, look at the territory before you look at the rep. In most cases, the territory is where the answer is.
Last updated: March 22, 2026