Sales Compensation Planning: How to Design Plans That Scale
Sales compensation planning that actually works — how to set OTE, choose plan structures, calibrate quotas, and build comp plans your reps will trust.
Sales compensation planning is one of the highest-leverage decisions a sales leader or RevOps manager makes. Get it right and you have reps who understand exactly what they're working toward and trust that they'll get paid fairly. Get it wrong and you have a commission process that burns management time, drives attrition, and quietly teaches reps not to bother reading their plans.
This guide covers how to build a sales compensation plan from scratch — or rebuild one that isn't working.
Why most comp plans break down
Before getting into the mechanics, it's worth understanding why so many plans fail in practice.
According to QuotaPath's 2024 survey of 450+ revenue leaders, 78% said their reps find their compensation plans difficult to understand. Plans that require a spreadsheet and 20 minutes to decode aren't motivating behavior — they're generating confusion and eroding trust.
The same pattern shows up in commission processing. When reps can't easily verify their own payouts, they start doing it manually. Vendor estimates suggest reps who shadow-account in personal spreadsheets spend 2-4 hours per week on commission recalculations — time that isn't spent selling. Commission errors compound this: every incorrect payout that slips through requires a correction cycle, a conversation, and a trust repair.
The root cause is usually design-phase shortcuts: plans built in response to competitive pressure, plans copied from a previous employer, or plans that started simple and accumulated exceptions over four fiscal years without a full redesign.
The components of a sales compensation plan
A complete sales compensation plan has five variables. Each one depends on the others, which is why designing them in isolation is a common mistake.
1. On-target earnings (OTE)
OTE is the total annual compensation a rep earns at 100% of quota — base salary plus variable pay. It's your primary market-positioning signal. Set OTE below market and you'll lose candidates to competitors; set it above market without a revenue model that supports it and you'll overspend on compensation.
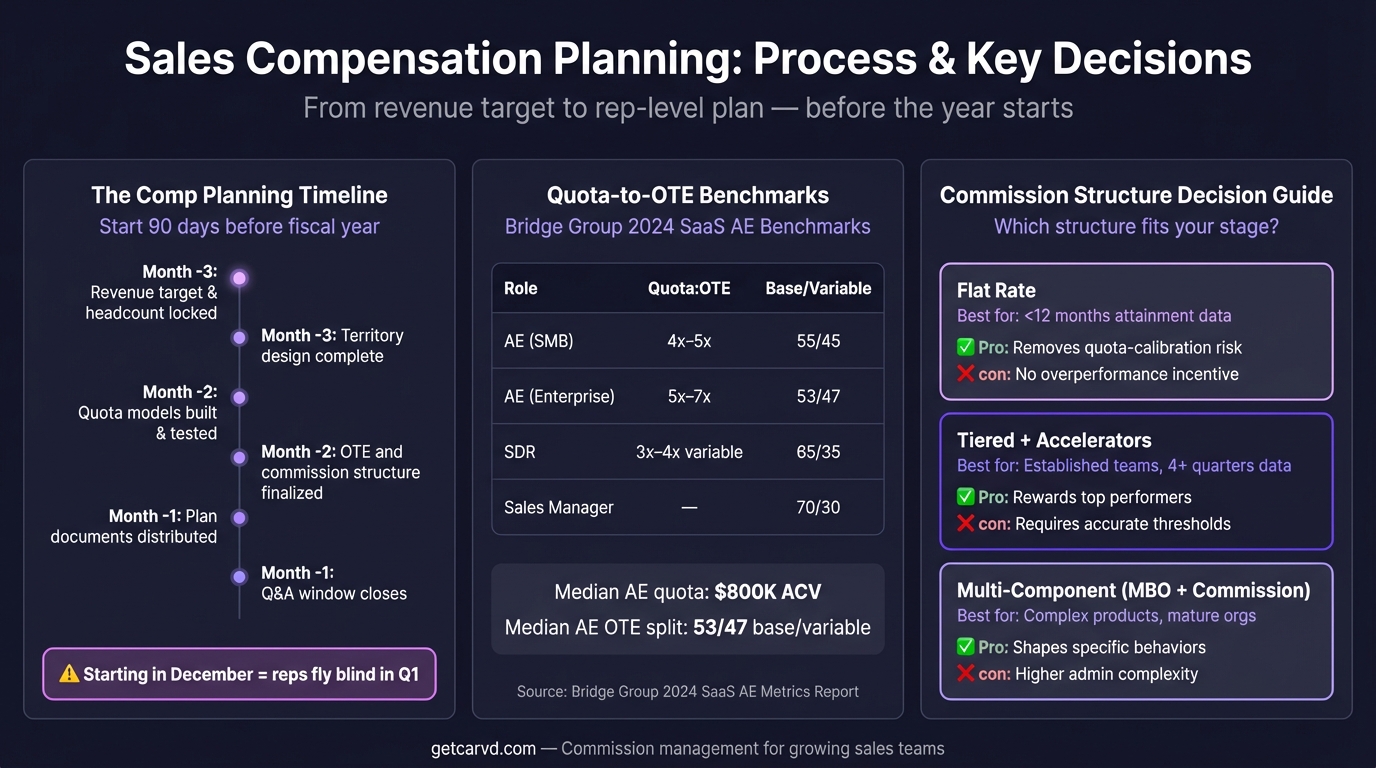
According to Bridge Group's 2024 SaaS AE Metrics & Compensation Benchmark Report, the median OTE for SaaS AEs is $190K, up from $167K in 2022. OTE varies significantly by segment: SMB AEs typically land between $120K-$160K, mid-market AEs $180K-$220K, enterprise AEs $250K+.
2. Pay mix (base-to-variable split)
Pay mix determines the ratio of fixed to variable compensation. Bridge Group's 2024 benchmark found the median SaaS AE pay mix is 53% base / 47% variable — effectively 50/50. SDRs and CSMs typically carry more base (65-75%) because their influence over direct revenue outcomes is less immediate.
A few principles that hold across most SaaS teams:
- The more control a rep has over deal outcomes, the higher the variable ratio can be
- Outbound-heavy roles tolerate more variable; inbound-heavy roles need more base stability
- New hires in unfamiliar territory usually need more base during ramp
3. Quota
Quota is the performance threshold at which a rep earns their full variable component. The rule of thumb that holds up well in practice: quota should be set at roughly 4-6x the rep's variable pay. A rep with $90K variable pay should have a quota between $360K-$540K. Below 4x and the plan is too easy; above 6x and you'll have systematic underattainment.
For benchmarking on quota attainment, Bridge Group's 2024 data puts median SaaS AE attainment at 65-70%, with well-calibrated plans landing 60-70% of reps at or above quota. If fewer than half your reps are hitting quota consistently, the quota number is almost always the problem — not rep performance.
4. Commission rate and structure
Commission rate is what reps earn per dollar of closed revenue. The structure determines how that rate scales. The three most common approaches:
- Flat rate: Single percentage on all closed revenue. Simple to understand and calculate. Works well for early-stage teams or homogeneous deal profiles.
- Tiered rate: Increasing percentages at higher attainment levels — for example, 8% on the first 100% of quota, 12% from 100-125%, 16% above 125%. Rewards overperformers without inflating base commission cost. See tiered commission structures for how the math works.
- Per-product rate: Different rates for different products or deal types. Useful when margins vary significantly across the portfolio, but adds complexity that compounds quickly with multiple product lines.
For SaaS AEs, Bridge Group's 2024 benchmark puts the implied commission rate at approximately 11-12% of ACV closed. The specific rate depends on your deal size, product margins, and OTE relative to quota.
5. Accelerators and kickers
Accelerators are multipliers that increase the commission rate above a quota threshold. They're the primary tool for rewarding overperformance. Common structure: 1.5x the base rate from 100-125% of quota, 2x above 125%.
Kickers are one-time bonuses for specific outcomes — closing a certain product, closing above a deal-size threshold, hitting a new-logo target. Use them sparingly. Stacking multiple kickers onto a base plan creates a payout model that nobody, including the comp plan author, can reliably calculate.
The planning process
Step 1: Start with what you're trying to drive
Before setting any number, define the behavior change. Are you trying to increase average deal size? Push a new product? Reduce churn from early-stage deals? Each of those goals maps to a different plan design. A plan optimized for deal volume looks different from one optimized for expansion revenue.
This sounds obvious, but most plans skip this step and jump to benchmarking. The result is a plan that matches market OTE but doesn't actually incentivize the specific outcomes that matter for the business in the current period.
Step 2: Model the cost at different attainment distributions
Before finalizing any plan, model what it costs at three scenarios using the commission plan builder to see OTE projections at different attainment levels: 50th percentile attainment (most reps hit 80-90% of quota), 70th percentile (most reps hit 100-110%), and 90th percentile (strong over-performance year).
According to Alexander Group benchmark data, the cross-industry B2B CCOS averages 7.9% of revenue. SaaS companies typically run 8-15% depending on growth stage. If your modeled payout in the 70th percentile scenario exceeds 15% of revenue, the plan needs restructuring before launch.
Step 3: Validate with reps before finalizing
The biggest mistake in sales compensation planning isn't the math — it's launching a plan without testing whether reps actually understand it. Share the plan design with 2-3 high-performing reps and a mid-performer before rollout. Ask them to calculate their hypothetical payout on last quarter's deals.
If they can't do it in under 5 minutes without a spreadsheet, the plan is too complex. If they calculate it incorrectly, you have a documentation problem. Both are fixable before launch; both become expensive after.
Step 4: Build the calculation infrastructure before the plan goes live
A plan is only as trustworthy as the payout process behind it. If you're calculating commissions in a spreadsheet with manual deal imports, reps will shadow-account and disputes will accumulate. Sales performance management tools and dedicated commission software let you give reps a deal-by-deal breakdown of how their payout was calculated — which is the single most effective thing you can do to reduce disputes.
For sales comp plan examples showing how these components come together at different team stages, the examples in that post cover five real plan structures from early-stage to scaling AE teams.
When to redesign vs recalibrate
Most plans need recalibration annually — quota adjustments, rate tweaks, new product additions. Full redesigns are rarer and usually triggered by one of four signals:
- Fewer than 50% of reps hitting quota for two consecutive periods. This is a structural problem, not a performance problem.
- High attrition among top performers. If the reps who overachieve leave fastest, your accelerators aren't rewarding overperformance enough.
- Significant changes to your go-to-market model — new segments, new products, channel expansion. Patchwork exceptions to an old plan accumulate into incoherence.
- A new product line that the existing plan actively discourages. When reps focus exclusively on one product because the commission math works out better, the plan is fighting your product strategy.
According to the Alexander Group's 2024 Sales Compensation Trends Survey, 91% of companies expected to make comp plan changes in 2024 — and two-thirds said they were shifting toward stronger pay-for-performance structures. Annual review is standard; annual redesign is not.
Operationalizing the plan
Designing the plan is step one. Operationalizing it is where most teams underinvest.
A well-operationalized comp plan has:
- A written plan document with worked examples (not just a summary slide)
- A calculation process that produces a deal-by-deal breakdown, not just a total
- A dispute resolution process with defined resolution timelines
- A regular attainment report so reps can see their progress mid-period
Tools like Carvd automate the calculation and reporting layer — Carvd's rep dashboards let reps see in real time how each deal contributed to their payout, and managers can run attainment reports without rebuilding a spreadsheet each period.
The goal isn't sophistication. It's that every rep on your team can tell you, without asking someone in finance, what they'll earn if they close the deal they're working on today.
Related reading
- Sales Compensation Plan: How to Structure Variable Pay
- Sales Comp Plan Examples: 5 Plans for Different Team Stages
- On-Target Earnings: What OTE Means and How to Calculate It
- Tiered Commission Structure: How It Works and When to Use It
- Quota Attainment: How to Measure, Benchmark & Improve It
- Sales Metrics: What to Track at Every Stage of the Funnel
Last updated: March 22, 2026