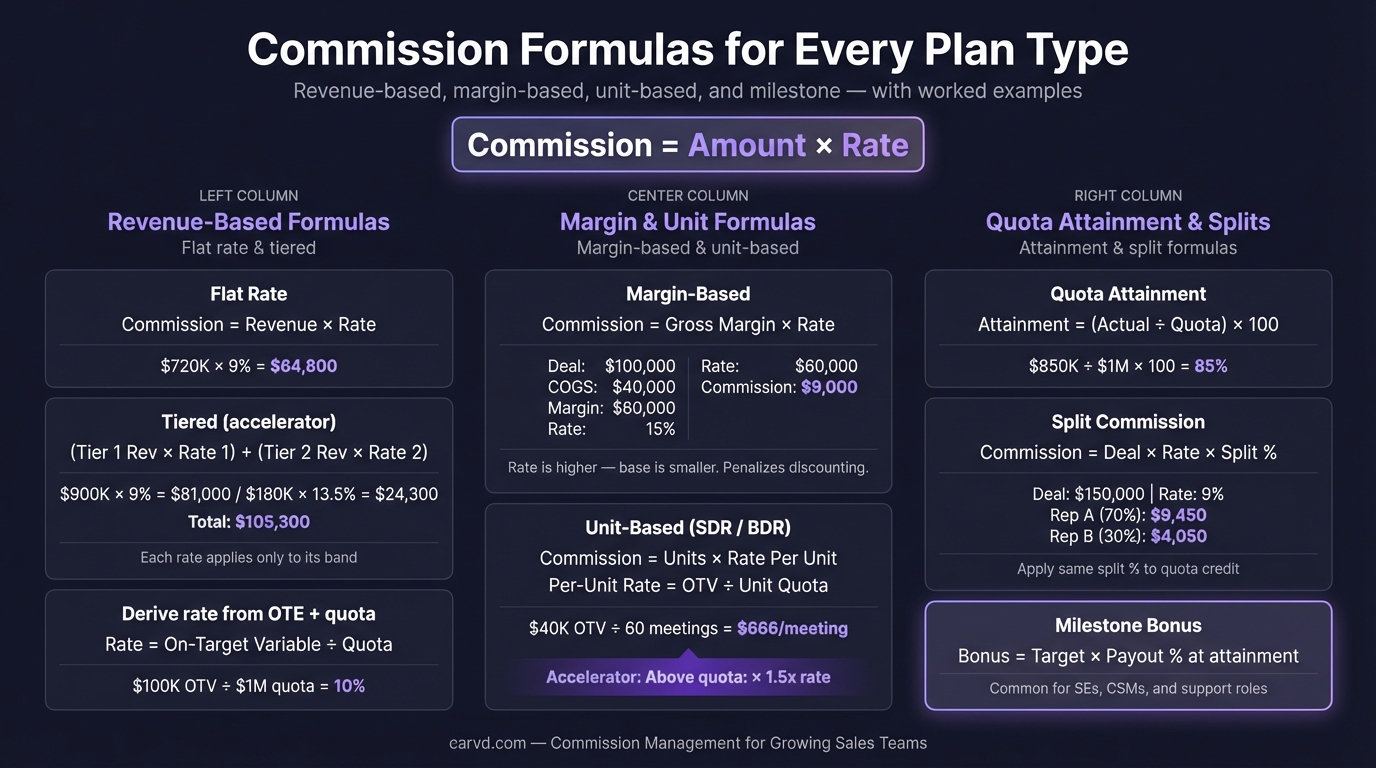
Commission Formula: Every Plan Type, With Examples
Quick-reference commission formulas for flat rate, tiered, per-product, accelerator, draw, and clawback plans. Worked examples for each plan type.
Every commission plan type uses a different formula. Use the wrong one and you're either overpaying, underpaying, or creating the conditions for a dispute that takes hours to resolve.
This is the reference guide: the formula for each plan type, a worked example, and the additional formulas — effective rate, draws, clawbacks — that most commission walkthroughs skip.
For a step-by-step calculation tutorial with more detailed examples, see how to calculate sales commission. This guide focuses on the formulas themselves.
The three inputs every commission formula needs
Before any formula runs, you need three things:
- Revenue base — the dollar amount the commission is applied to. Usually deal value (ACV), monthly recurring revenue, or collected cash, depending on plan design.
- Commission rate — the percentage paid per dollar of revenue. The Bridge Group's 2024 SaaS AE Metrics & Compensation Benchmark Report (170+ B2B SaaS companies) puts the median commission rate at approximately 11.5% of ACV.
- Quota — only required for plans with accelerators, decelerators, or quota-gated payments.
Some plans also require product codes (for per-product rates) and a pay period start/end date (for draw calculations). Get the inputs wrong and the formula produces the correct answer to the wrong question.
Flat rate commission formula
The simplest plan. One rate applied to all revenue, regardless of deal size or volume.
Formula:
Commission = Revenue × Rate
Example: A rep closes $85,000 in a quarter. Commission rate is 10%.
$85,000 × 0.10 = $8,500
Flat rate plans are easy to verify — reps can calculate their own payout in seconds with nothing more than a phone calculator. The downside is they don't differentiate performance above quota; a rep at 150% of quota earns proportionally the same as a rep at 80%.
Tiered commission formula
Tiered plans pay increasing rates as revenue crosses defined thresholds. The critical rule: each rate applies only to revenue within that tier, not to total revenue.
Formula:
Tier commission = Revenue in tier × Tier rate
Total commission = Sum across all tiers
Example: Commission tiers:
- $0–$50,000: 8%
- $50,001–$100,000: 12%
- Above $100,000: 15%
Rep closes $120,000.
| Tier | Revenue in tier | Rate | Commission |
|---|---|---|---|
| First $50,000 | $50,000 | 8% | $4,000 |
| $50,001–$100,000 | $50,000 | 12% | $6,000 |
| Above $100,000 | $20,000 | 15% | $3,000 |
| Total | $120,000 | — | $13,000 |
The common error is applying the top-tier rate to all revenue: 15% × $120,000 = $18,000 — an overpayment of $5,000. According to Palette HQ's 2023 State of Sales Compensation survey, 56% of companies report experiencing commission errors regularly (vendor survey, methodology not fully disclosed). Tiered plan misapplication is one of the most frequent causes. You can verify any tiered calculation instantly with a commission calculator that applies marginal rates correctly.
Per-product commission formula
Different rates for different products, typically to incentivize margin-accretive or strategic SKUs.
Formula:
Commission = (Revenue_A × Rate_A) + (Revenue_B × Rate_B) + ...
Example: A rep sells:
- $60,000 of core platform (10%)
- $20,000 of add-on module (15% — strategic push)
- $10,000 of professional services (5% — lower margin)
($60,000 × 0.10) + ($20,000 × 0.15) + ($10,000 × 0.05)
= $6,000 + $3,000 + $500
= $9,500
Per-product plans scale calculation complexity fast. Three products and 12 reps means 36 separate rate lookups per pay period, before you factor in any quota components. Build commission formulas in a Stackrows template before moving to software. This is where manual spreadsheet errors tend to compound.
Accelerator commission formula
Accelerators pay a higher rate on revenue above quota. They reward over-performance without raising the base rate that applies to all revenue.
Formula:
Below-quota commission = Quota × Base rate
Above-quota commission = (Revenue − Quota) × (Base rate × Accelerator)
Total = Below-quota + Above-quota
Example:
- Quota: $100,000
- Base rate: 10%
- Accelerator: 1.5x above quota
- Actual revenue: $125,000
Below quota: $100,000 × 0.10 = $10,000
Above quota: $25,000 × (0.10 × 1.5) = $25,000 × 0.15 = $3,750
Total: $13,750
Stepped accelerators apply the same logic across multiple bands. A plan with 1.25x at 100%–120% and 1.5x above 120% requires two separate above-quota calculations:
- Band 1 (100%–120% of quota): calculate revenue in band × base rate × 1.25
- Band 2 (above 120% of quota): calculate revenue in band × base rate × 1.5
- Sum all three results (below quota + band 1 + band 2)
Draw against commission formula
A draw is an advance payment deducted from future earned commission. Two types: recoverable draws (the rep must repay any deficit) and non-recoverable draws (deficits are forgiven).
Recoverable draw — balance formula:
Balance owed = Cumulative draws advanced − Cumulative commission earned
A positive balance means the rep owes money back. A negative balance means they've earned above the draw and receive the surplus.
Example: A new hire gets a $5,000/month draw during onboarding. In month 1, they earn $3,200 in commission.
Balance owed after month 1 = $5,000 − $3,200 = $1,800
In month 2, they earn $7,400 in commission. The draw is still $5,000.
Month 2 draw taken: $5,000
Month 2 commission earned: $7,400
Running balance: $1,800 (prior deficit) − ($7,400 − $5,000) = $1,800 − $2,400 = −$600
The deficit is fully recovered. The rep receives $5,600 for month 2 ($5,000 draw + $600 surplus).
Non-recoverable draw — payout formula:
Payout = Max(Draw amount, Commission earned)
The rep receives whichever is higher. They never owe back the difference if commission falls below the draw amount.
For more on how draws work in practice, see draw against commission.
Commission clawback formula
Clawbacks recover commission when a deal falls through — customer churn, contract cancellation, or non-payment within a defined period.
Standard clawback:
Clawback amount = Commission paid × Clawback percentage
A policy with 100% recovery within a 6-month window: if a rep earned $5,000 commission on a deal that cancels in month 3, they owe back $5,000.
Partial clawback policies apply the same formula with a lower percentage — a 50% clawback policy on the same deal recovers $2,500.
Pro-rated clawback — for plans that scale recovery based on how much of the contract term was fulfilled:
Clawback = Commission paid × (Remaining contract months ÷ Total contract months)
Example: Rep earned $6,000 commission on a 12-month contract. Customer cancels at month 4 (8 months remain).
$6,000 × (8 ÷ 12) = $6,000 × 0.667 = $4,000 clawback
For more detail on clawback policy design, see commission clawback.
Effective commission rate formula
Effective rate shows what percentage of total revenue was paid out as commission — the clearest signal that your plan is calibrated correctly, regardless of plan structure.
Formula:
Effective commission rate = Total commission paid ÷ Total revenue
Example: A team of 10 reps closes $2.4M in a quarter. Total commission paid: $264,000.
$264,000 ÷ $2,400,000 = 11%
The Bridge Group's 2024 benchmark puts the median SaaS AE effective commission rate at approximately 11.5% of ACV. An effective rate well above 14% suggests either an off-market plan or a calculation error paying more than intended. A rate below 8% suggests either a conservative plan or one that isn't rewarding strong performance adequately.
Run this check after every commission period before processing payroll. Once validated, a payroll export feature turns your commission run into a payroll-ready CSV in one click.
Quick reference: all commission formulas
| Plan type | Formula |
|---|---|
| Flat rate | Revenue × Rate |
| Tiered | Sum of (Revenue in tier × Tier rate) for each tier |
| Per-product | Sum of (Revenue per product × Product rate) |
| Accelerator — below quota | Quota × Base rate |
| Accelerator — above quota | (Revenue − Quota) × (Base rate × Accelerator) |
| Recoverable draw balance | Cumulative draws − Cumulative commission earned |
| Non-recoverable draw payout | Max(Draw amount, Commission earned) |
| Clawback | Commission paid × Clawback percentage |
| Pro-rated clawback | Commission paid × (Remaining months ÷ Total months) |
| Effective commission rate | Total commission ÷ Total revenue |
For plan design guidance — how to choose rates, set tier thresholds, and structure accelerators — see the sales commission structure guide. For a full walkthrough of multi-plan calculations with combined components, see how to calculate sales commission.
Tools like Carvd apply all of these formulas to your CRM data automatically and show reps the exact calculation behind every payout — so disputes start from a shared source of truth rather than dueling spreadsheets. For a comparison with enterprise ICM tools, see how Carvd compares to CaptivateIQ.
Related reading:
Last updated: March 22, 2026