Sales KPIs: The Metrics That Drive Revenue and Comp Plan Decisions
A practical guide to sales KPIs for sales ops and RevOps leaders — covering pipeline, conversion, quota, and commission operations metrics with benchmarks.
Most sales teams track too many metrics and act on too few. The problem isn't access to data — it's knowing which KPIs connect to which decisions, and which ones are noise.
A functional KPI stack does three things: it tells you where revenue will come from (pipeline), whether deals are converting efficiently (velocity and win rates), and whether your compensation process is working (commission operations). Most dashboards cover the first two. Almost none systematically track the third.
This guide covers the sales KPIs that actually drive decisions — organized by what they tell you, benchmarked against verified industry data, and with particular attention to the commission operations metrics most sales teams skip.
What makes a metric a KPI
A metric is any number you can measure. A KPI is a metric you've decided to act on — one that, when it moves, triggers a specific response.
"Number of calls made per day" is a metric. If your team policy is to investigate whenever it drops below 10, it becomes a KPI. The distinction matters because tracking metrics without decision triggers creates reporting overhead without driving behavior.
Before adding a metric to your KPI stack, answer two questions: What decision does this inform? What's the threshold that would cause us to act? If you can't answer both, it's probably a metric, not a KPI.
Leading vs lagging KPIs
Every KPI is either a leading indicator (predictive) or a lagging indicator (retrospective). You need both.
Lagging KPIs measure outcomes that have already happened: quota attainment, total revenue closed, win rate. They're accurate but backward-looking. By the time they move, the decisions that caused it are weeks or months in the past.
Leading KPIs measure pipeline health and activity before deals close: pipeline coverage ratio, days since last customer contact, number of qualified opportunities created. They're predictive but imperfect. High activity doesn't guarantee revenue — but it gives you a signal before the quarter ends.
The practical implication: lagging KPIs tell you what happened; leading KPIs tell you what to do now. A team that only reviews attainment after quarter-close is always reacting. A team that monitors pipeline coverage and creation rate mid-quarter can intervene before deals fall out.
Pipeline KPIs
Pipeline coverage ratio
Pipeline coverage is the ratio of open pipeline value to quota for the period. The standard benchmark is 3x-4x — $300K-$400K in pipeline for a $100K quarterly quota. Enterprise teams with longer cycles typically need 4x-6x because lower win rates mean more deals fall out before close.
Coverage below 3x is a leading indicator of a missed quarter, visible 60-90 days before the quarter ends. It means reps need to either create more pipeline or management needs to address quota expectations — and that decision is better made early.
When to act: Coverage below 2.5x with fewer than six weeks left in the period. Coverage consistently above 5x may mean quota is underpriced or the pipeline definition is too loose.
Pipeline creation rate
How many new qualified opportunities are created per rep per week or month. Coverage is a snapshot; creation rate is the trend. A team with strong coverage today but low creation rate will see that coverage erode over the next 60-90 days.
Track this alongside coverage. A team with 3.8x coverage and flat creation rate is fine today. A team with 3.8x coverage and declining creation rate has a problem arriving in the next quarter.
Average deal size
Average deal size tells you what kind of buyers your pipeline attracts. It also matters for compensation planning: deal size distribution affects payout variance. A team with a few massive deals and many small ones will have highly variable monthly commission expenses compared to a team with consistent deal sizes — which makes budgeting for comp harder and creates more month-to-month noise in commission calculations.
Track it over time. Shrinking average deal size often reflects competitive pressure or an unmanaged drift downmarket that isn't visible in total revenue until several quarters later.
Conversion and velocity KPIs
Win rate
Win rate is the percentage of qualified opportunities that close as won. According to the Bridge Group's 2024 SaaS AE Metrics & Compensation Benchmark Report, which surveyed 172 B2B SaaS companies, the median win rate for SaaS AEs is 19% — down from 23% in 2022. Win rates above 25% are strong for mid-market SaaS; enterprise teams typically target 15-20%.
Win rate connects directly to comp plan costs. If your average deal is $100K and your win rate drops from 22% to 17%, your pipeline needs to be roughly 30% larger to generate the same revenue. That affects how much pipeline creation the team needs to sustain — and at what comp rate that pipeline conversion is economical.
What win rate alone doesn't tell you: whether the loss is competitive (another vendor won) or a no-decision (the prospect didn't buy from anyone). The distinction matters for comp design. Competitive losses might be a pricing or product problem; no-decisions might be a targeting or qualification problem. Both reduce attainment, but the fixes are different.
Sales cycle length
How long it takes an opportunity to move from qualified to closed. According to the Ebsta x Pavilion 2024 B2B Sales Benchmarks Report, which analyzed 4.2 million opportunities across 530 companies, 70% of B2B reps missed quota in 2024, with longer deal cycles as a contributing factor.
For compensation planning, longer cycles create a cash flow timing problem: the work of closing a deal happens this quarter, but the payout may land in the next. If your cycle is extending, commission expense in any given period reflects deals sourced two or three cycles ago — which makes comp plan modeling harder and creates rep frustration when payouts don't match recent effort.
Stage conversion rates
What percentage of opportunities progress from each stage to the next. Win rate is the end result; stage conversion shows you where deals are dying.
If deals are stalling at proposal, that's a pricing or ROI problem. If they're stalling at legal, that's a contract process problem. If they're stalling at demo, qualification is likely too loose. Stage conversion data directs remediation to the right part of the funnel — which is a different fix than coaching reps to "close harder."
Quota and performance KPIs
Quota attainment
Quota attainment is the percentage of a sales target that a rep achieves in a given period. It's the most-tracked sales KPI and one of the least actionable on its own — it tells you where a rep landed, not why.
The Bridge Group's 2024 report found 51% of SaaS AEs hit quota, down from 66% in 2022. Salesforce's State of Sales 6th Edition (2024), based on a survey of 5,500 sales professionals across 27 countries, found 67% of reps don't expect to hit quota in their current role.
Those headline numbers are concerning — but they're also easy to misread. Forrester analyst Seth Marrs has noted that company-wide average attainment of around 47-50% is common and not inherently a problem, because quota plans are designed so that most reps land below 100%. Accelerators concentrate reward in top performers; if everyone hits 100%, quotas were probably set too low.
The more useful version of this KPI is attainment distribution:
| Tier | Attainment | What it indicates |
|---|---|---|
| Top performers | 125%+ | Accelerators are working; check territory fairness |
| On-plan | 80-124% | Core of the team; comp plan is motivating |
| Underperforming | 50-79% | Performance issue or quota may be too high for the territory |
| At risk | Below 50% | Quota likely unrealistic, or rep is a retention risk |
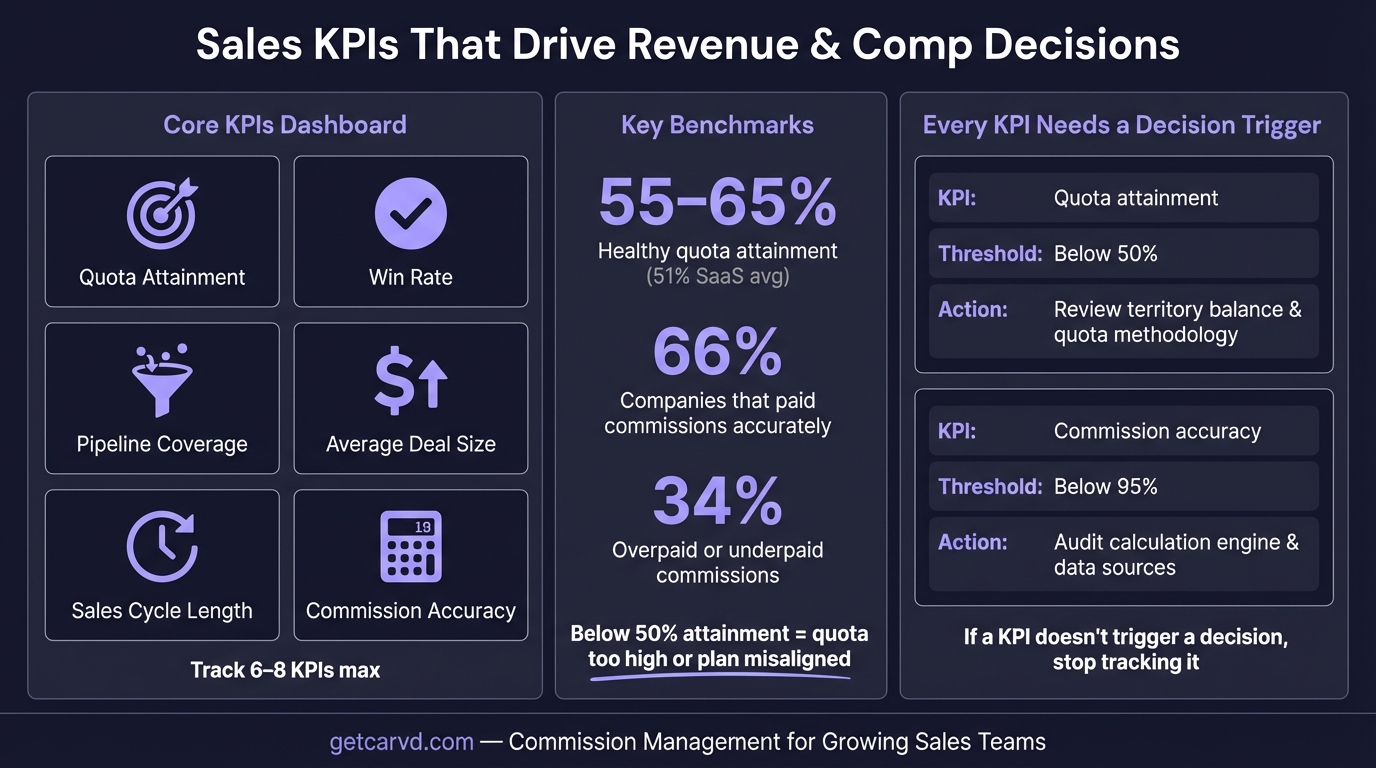
Alexander Group benchmarks a healthy plan at 55-65% of reps achieving quota or better. Below 50% consistently signals a quota-setting or plan design problem, not just a performance problem.
Attainment by tenure
Quota attainment broken out by how long a rep has been in their role. This surfaces ramp problems. If reps in their first two quarters have attainment well below the team median, either the ramp quota isn't calibrated to realistic ramp curves, or onboarding isn't building pipeline early enough.
The Xactly 2024 Sales Compensation Report, which surveyed 230 companies, found 77% use ramp periods of six months or less for new AEs. Plans that hold new reps to full quota during ramp inflate team-level miss rates and create early attrition — a comp plan design problem masquerading as a performance problem.
Revenue per rep
Total revenue generated divided by number of revenue-generating reps. A simple number that captures both quota sizing and headcount efficiency. Tracked over time, it reveals whether the team is getting more or less productive per head — which is the actual answer to whether compensation spend is working.
Commission operations KPIs
This is the category most sales dashboards omit. The metrics below measure whether your compensation process is working — not just whether deals are closing. They matter because commission errors don't just affect ops overhead; they affect rep trust, which affects sales behavior.
Salesforce's State of Sales 6th Edition found that reps spend only 30% of their time actually selling. Shadow accounting — reps independently tracking their own commission calculations to verify payouts — is one reason. When reps don't trust the comp process, they spend selling time reconciling numbers instead.
Commission accuracy rate
The percentage of commission calculations that are correct without requiring adjustment after initial processing. CaptivateIQ's 2025 State of Incentive Compensation Management Report, which surveyed 200+ compensation leaders, found that 66% of companies overpaid or underpaid commissions in the past year. An earlier study by Xactly and OpenSymmetry found that 83% of companies had commission payment inaccuracies, at rates averaging above 5%.
The downstream effects of low accuracy are significant. Each error creates dispute overhead — ops time to investigate, finance time to adjust, rep time to re-verify. More damaging is the trust erosion: reps who receive wrong statements don't assume the error will be caught and corrected; they assume they've been underpaid and start tracking their own numbers.
A commission accuracy rate below 95% is a signal worth investigating. Common root causes: manual data entry into spreadsheets, overlapping or ambiguous plan rules, and deal crediting that isn't tied to a single system of record. Moving deal data through a CSV deal import pipeline into a dedicated commission tool eliminates the manual entry errors at the source.
Time-to-pay
How many days after a period closes before reps receive their commission statement and payment. CaptivateIQ's 2025 State of Incentive Compensation Management Report found that companies spend an average of 89 hours per month on commission-related administration — payouts, reviews, troubleshooting. Long processing times sever the connection between closing a deal and seeing the reward.
Variable comp works as a motivator when the feedback loop is tight. A rep who closes a deal on March 31st and receives their commission statement on April 18th has already moved on mentally. The motivational signal is weakest when it's most delayed.
Benchmark: Commission statements within 5 business days of period close. Payment within 10-15 business days.
Commission dispute rate
The percentage of commission runs that generate at least one rep dispute. A high dispute rate typically indicates one of three problems: plan complexity that reps can't verify independently, data discrepancies between what reps expect to be credited and what gets calculated, or deal-level statements that don't show how each payout was derived.
Track dispute rate over time. A falling rate means process improvements are working. A flat or rising rate means the root cause hasn't been addressed.
Shadow accounting rate
Shadow accounting is when reps maintain their own spreadsheets to independently verify commission calculations. It's hard to measure directly, but a proxy is how often reps contact sales ops with "can you explain my number" questions — and how much time ops spends answering them each period.
High shadow accounting signals low trust in the commission process. The fix is usually transparency, not accuracy: rep dashboards that show deal-level statements with exactly how each payout was calculated, so reps can verify without running parallel calculations.
How KPIs connect to comp plan decisions
The value of tracking KPIs isn't just reporting. Each KPI signals something about whether the comp plan is working — or where it needs adjustment.
Low quota attainment (below 50% of reps at quota): First check if this is a quota problem, not a performance problem. Compare quota levels to territory potential. If attainment is consistently low in territories with demonstrably smaller addressable markets, quotas are set wrong. If attainment is low across all territories, it may be a plan structure issue — for example, accelerators that kick in at 100% when median attainment is 72%.
Declining win rate with stable pipeline creation: The issue is competitive positioning or deal qualification, not pipeline volume. A commission plan change won't fix this; better qualification criteria and competitive positioning will.
High dispute rate with low commission accuracy: The comp process needs a structural fix — probably deal-level transparency and a move away from manual calculation. This isn't a rep management issue; it's an ops infrastructure issue.
Bimodal attainment distribution (few reps at 150%+, many below 50%): Usually traces to unequal territory design. Top attainment concentrated in one or two reps often means they have the richest territories, not that they're more skilled. ICONIQ Growth data found that 58% of companies over-assign individual quotas by 20-30% above revenue targets — in practice, this means different reps are working against very different effective targets depending on how quota was allocated.
CaptivateIQ's 2025 Sales Compensation Benchmarks Report found that top-performing organizations use just 3 core metrics in their compensation plans. Plan complexity doesn't improve alignment — it usually reduces it. Reps optimize for the metrics they can calculate themselves. Use the commission rate benchmarks tool to verify your rates are competitive before finalizing plan KPIs. When presenting this minimal set to your board, Deckary builds consulting-grade slides.
Building a minimal KPI stack
You don't need 20 metrics. You need coverage across four areas:
Pipeline health (leading):
- Pipeline coverage ratio
- Pipeline creation rate
Conversion efficiency (mixed):
- Win rate
- Sales cycle length
Revenue performance (lagging):
- Quota attainment distribution
- Revenue per rep
Commission operations (lagging, often omitted):
- Commission accuracy rate
- Time-to-pay
- Commission dispute rate
That's nine KPIs. For most teams with 10-50 reps, this covers the decisions that actually matter: whether the pipeline will convert, whether reps are on track, and whether the comp process is functioning.
For teams managing more complex plans — multiple overlapping quotas, product-specific accelerators, territory overlays — adding plan cost rate (actual commission expense as a percentage of revenue) gives finance visibility into whether the plan is staying within budget as deals close.
How commission software surfaces these KPIs
Most CRM platforms surface pipeline and conversion KPIs well. What they typically don't surface is commission operations metrics — accuracy rates, dispute rates, time-to-pay — because those depend on the commission calculation layer, not the deal layer.
Commission software like Carvd calculates payouts at the deal level from the same data source used for quota tracking. Every rep can see exactly which deals counted, what rate applied, and how their payout was derived — without asking ops. That deal-level transparency reduces shadow accounting and creates the data trail needed to measure accuracy rate and dispute rate over time.
The shift from spreadsheet-based commission processing to software changes what's measurable, not just what's automated. Accuracy rate and dispute rate can't be tracked reliably in a spreadsheet because there's no audit trail — you only know about errors when someone raises them.
Related reading
- Sales Metrics: What to Track at Every Stage of the Funnel
- Quota Attainment: How to Measure, Benchmark & Improve It
- Sales Performance Management: Strategy, Tools & Best Practices
- Commission Reporting: What Sales Ops Actually Needs
- Sales Compensation Plan: How to Build One That Works
- Sales Comp Plan Examples: 6 Structures With Real Numbers
Last updated: March 22, 2026