Commission Rate Benchmarks: What's Normal by Industry and Role
Commission rate benchmarks by industry and sales role. Compare your rate against SaaS, insurance, real estate, manufacturing, and more using verified 2025-2026 data.
The right commission rate depends on your industry, your sales role, and your deal size. The Carvd commission rate benchmarks tool lets you look up typical rates by industry and role, compare your current rate against market data, and see how your effective rate stacks up against peers.
This guide covers how to use the tool and what the benchmark data actually shows — including where the industry averages come from and how to interpret them for your specific situation.
How to use the commission rate benchmarks tool
The tool at /tools/commission-rate-benchmarks works two ways:
| Mode | Use when you want to... |
|---|---|
| Look up by industry | Find the typical commission rate range for your sector |
| Look up by role | Find the typical range for your sales position (SDR, AE, AM, manager) |
Select your industry or role and the tool returns the typical range, the median, and a quick interpretation of where your current rate sits relative to market. No account required.
Commission rates by sales role
Commission rates differ significantly by role — not because companies are inconsistent, but because the role's influence on deals varies.
Sales development representatives (SDRs)
SDRs typically earn 3–5% on closed-won deals they sourced, calculated against revenue. Some companies pay SDRs a flat bonus per qualified meeting or SQL rather than a percentage of closed revenue — partly because SDRs have no direct control over close rates.
A flat-rate SDR structure might look like:
- $200–$400 per booked meeting that advances past discovery
- $500–$1,000 per deal that closes, regardless of deal size
Percentage-based SDR commission is less common but cleaner for high-ACV deals where even a 3% share represents significant income.
Account executives (AEs)
The Bridge Group's 2024 SaaS AE Metrics & Compensation Benchmark Report puts the median AE commission rate at 11.5% of ACV at 100% quota attainment. The typical range across the market runs 11–14%.
At that rate, quota-to-OTE ratios matter: the same report shows a median quota-to-OTE of 4.2x. So if your OTE is $180K and the commission rate is 11.5%, your implied quota is roughly $730K annually.
Common AE rate ranges by company stage:
| Stage | Commission rate range |
|---|---|
| Seed/Series A | 8–12% |
| Series B/C | 10–14% |
| Growth/public | 9–12% |
Rates tend to compress slightly as companies scale and deal sizes increase — the dollar payout stays competitive even as the percentage drops.
Account managers (AMs) and customer success
Account managers earning commissions on upsells and expansions typically see 5–10% on new revenue added to an existing account. Renewal commission (where it exists) usually runs lower — 1–3% — because renewal risk is lower and the rep's influence on the outcome is less direct.
Some companies pay AMs on a "new logo / expansion only" basis, with no commission on pure renewals. That structure simplifies accounting but can create misaligned incentives around churn.
Sales managers
Sales managers typically earn 2–5% on team revenue as an override, in addition to their base salary. Override structures reward building a high-performing team rather than personal deal volume. At a 3% override on a 10-rep team generating $10M annually, the manager earns $300K in overrides — typically against an OTE that includes base salary.
Commission rates by industry
Industry averages reflect differences in deal size, sales cycle length, and margin structure. Higher-margin, shorter-cycle products tend to support higher percentage rates. Large-deal, long-cycle, low-margin industries use lower rates because the dollar payout is still significant.
| Industry | Typical range | Notes |
|---|---|---|
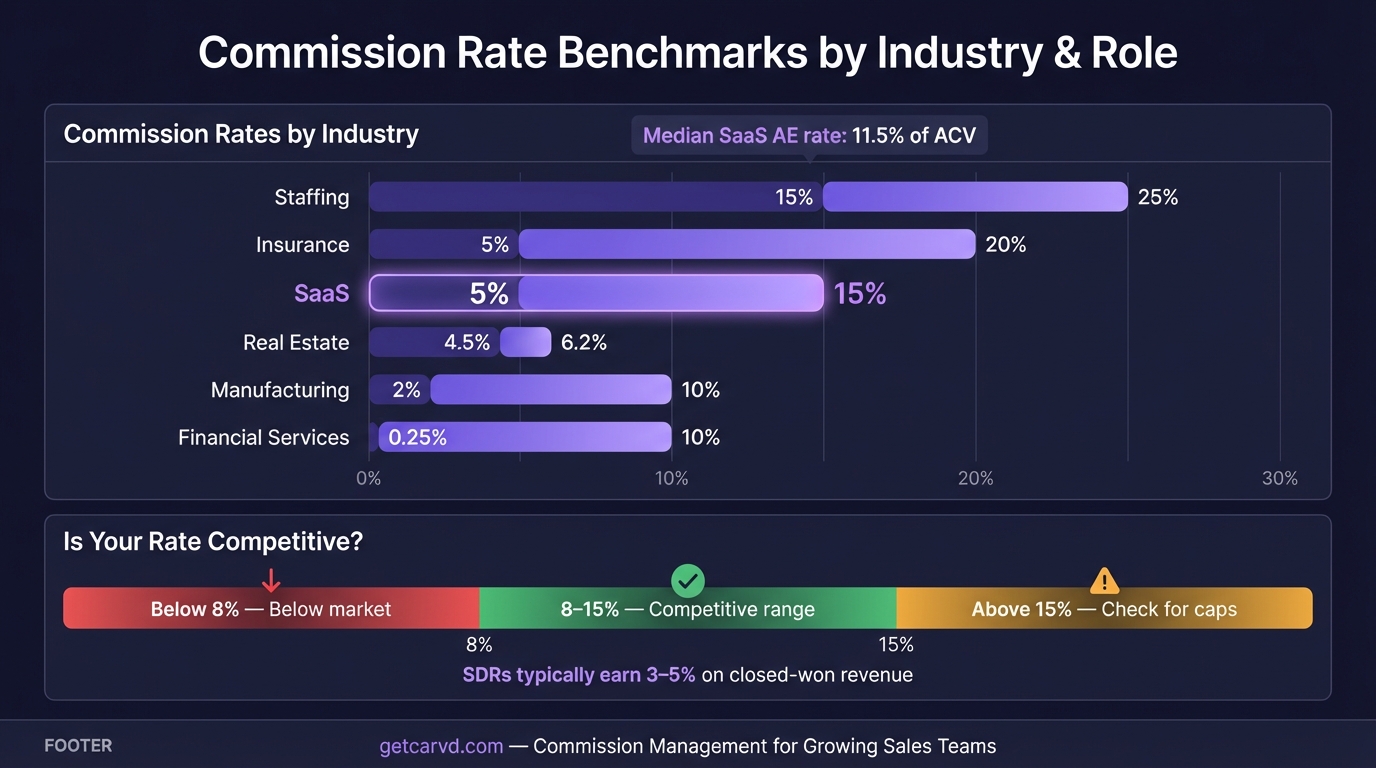
| Staffing / Recruiting | 15–25% | Direct placement; higher for executive search |
| Insurance | 5–20% | Independent agents average higher than captive |
| SaaS / Software | 5–15% | Median 11.5% for AEs per Bridge Group 2024 |
| Telecom | 5–20% | Varies significantly by product line |
| Medical Devices | 5–30% | Wide range: disposables (5–14%) vs. capital equipment |
| Advertising / Media | 15–32% | Higher performance-based component |
| Manufacturing | 2–10% | Lower rates on large-ticket, complex equipment |
| Financial Services | 0.25–10% | Mutual funds at low end; annuities and insurance products higher |
| Real Estate | 4.5–6.2% | Post-NAR settlement (August 2024), buyer/seller commission structures shifted |
The gap between staffing (15–25%) and real estate (4.5–6.2%) reflects deal size: a $500K home sold at 3% generates more commission than most staffing placements.
SaaS benchmarks in detail
For SaaS sales specifically, the Bridge Group 2024 data provides the clearest benchmarks:
- Median commission rate: 11.5% of ACV
- Base-to-variable split: 53% base / 47% variable
- Quota attainment: 51% of AEs hit quota in 2024, down from 66% in 2022
- Accelerators: Most plans include a 1.5x–2x multiplier for above-quota performance
The attainment number matters for comp plan design. If 51% of your reps hit quota, then OTE — which assumes 100% attainment — is what roughly half your team earns. The other half earns less. A plan where only 30% hit OTE is either a quota-setting problem or a hiring problem.
How to interpret your commission rate
A commission rate doesn't exist in isolation. Three factors determine whether a rate is competitive:
1. Absolute dollar payout at quota
A 5% rate on $1M annual quota produces $50K in variable income. A 15% rate on $200K annual quota produces $30K. The lower rate on bigger deals pays more. Compare rates at the same revenue level before drawing conclusions.
2. Effective rate vs. stated rate
The stated commission rate is what the plan document says. The effective rate is total commission paid divided by total revenue generated. If your plan has tiers or accelerators, the effective rate changes with performance. Use the commission calculator to model your effective rate at 80%, 100%, and 120% quota attainment.
3. Total OTE against market
Rate benchmarks matter less than OTE benchmarks. According to the Bridge Group 2024 data, median SaaS AE OTE is $190K. If your plan's rate produces $190K at 100% attainment with a competitive base, the rate is calibrated correctly — regardless of whether it's 9% or 13%.
What commission rate data doesn't tell you
Benchmarks give you a reference point. They don't account for:
Plan structure. A flat 10% rate and a tiered plan averaging 10% at quota produce the same payout at 100% attainment — but very different payouts at 80% or 130%. Structure matters as much as rate.
Ramp periods. New reps typically start on a draw or reduced quota for 60–90 days. A 12% commission rate sounds strong, but if the first quarter is partially guaranteed against a lower quota, the effective first-year rate is different.
Clawback provisions. Some plans claw back commission on deals that churn within 90 or 180 days. A 12% rate with a 6-month clawback window is a different risk profile than a 10% rate with no clawback. Managing clawbacks and related disputes is easier with a built-in dispute resolution workflow that ties each adjustment to the original deal record.
For understanding how plan structure affects total payout, use the commission plan builder to model your current plan at different attainment levels.
Designing a plan around benchmarks
When setting commission rates, the benchmark is a starting point — not the answer.
Start with target OTE. For a SaaS AE role with $180K OTE and a 50/50 pay split, the variable target is $90K. If the annual quota is $800K, the required rate is $90K ÷ $800K = 11.25%.
Check against benchmarks. 11.25% falls within the 11–14% range for SaaS AEs, so the plan is market-competitive.
Model the full range. At 80% attainment ($640K revenue), commission is $71,840 — bringing total comp to $161,840. At 120% attainment ($960K), commission is $108,000 before any accelerator, bringing total comp to $198K. Are those numbers sustainable and motivating?
Add accelerators deliberately. Most plans include a 1.5x multiplier above 100% quota. At $960K with a 1.5x accelerator on the above-quota $160K, commission becomes: $90K base commission + ($160K × 16.875%) = $90K + $27K = $117K variable, total comp $207K. That's the reward for strong performance — and it needs to fit your margin structure.
Tools like Carvd automate these calculations at scale, so you're not rebuilding commission models in a spreadsheet every time a rep's deal count changes. For a side-by-side look at how Carvd handles rate modeling versus other platforms, see how Carvd compares to Qobra.
Related tools and guides
- Commission Calculator — Calculate flat rate, tiered, base + commission, split, and find-rate in one tool
- OTE Calculator — Model on-target earnings from base salary and commission rate, evaluate job offers, and reverse-engineer quota
- Commission Plan Builder — Model flat, tiered, and draw plans and see OTE projections at 80%, 100%, and 120% attainment
Related guides:
- Sales Commission Structure — Full guide to every commission structure type with examples
- How to Calculate Commission — Step-by-step walkthrough with formulas for every plan type
- Sales Commission Calculator — Guide to the main calculator with formulas and worked examples
- On-Target Earnings (OTE) — How OTE is calculated and what quota-to-OTE ratios to expect by role
- Average Sales Commission Rates — Comprehensive benchmark page with commission rate data across industries and roles
Last updated: March 22, 2026