Average Sales Commission Percentage: 2026 Benchmarks by Industry & Role
The average sales commission percentage is 11.5% for SaaS AEs (Bridge Group 2024). This guide covers verified benchmarks across 9 industries and 6 sales roles with pay mix data.
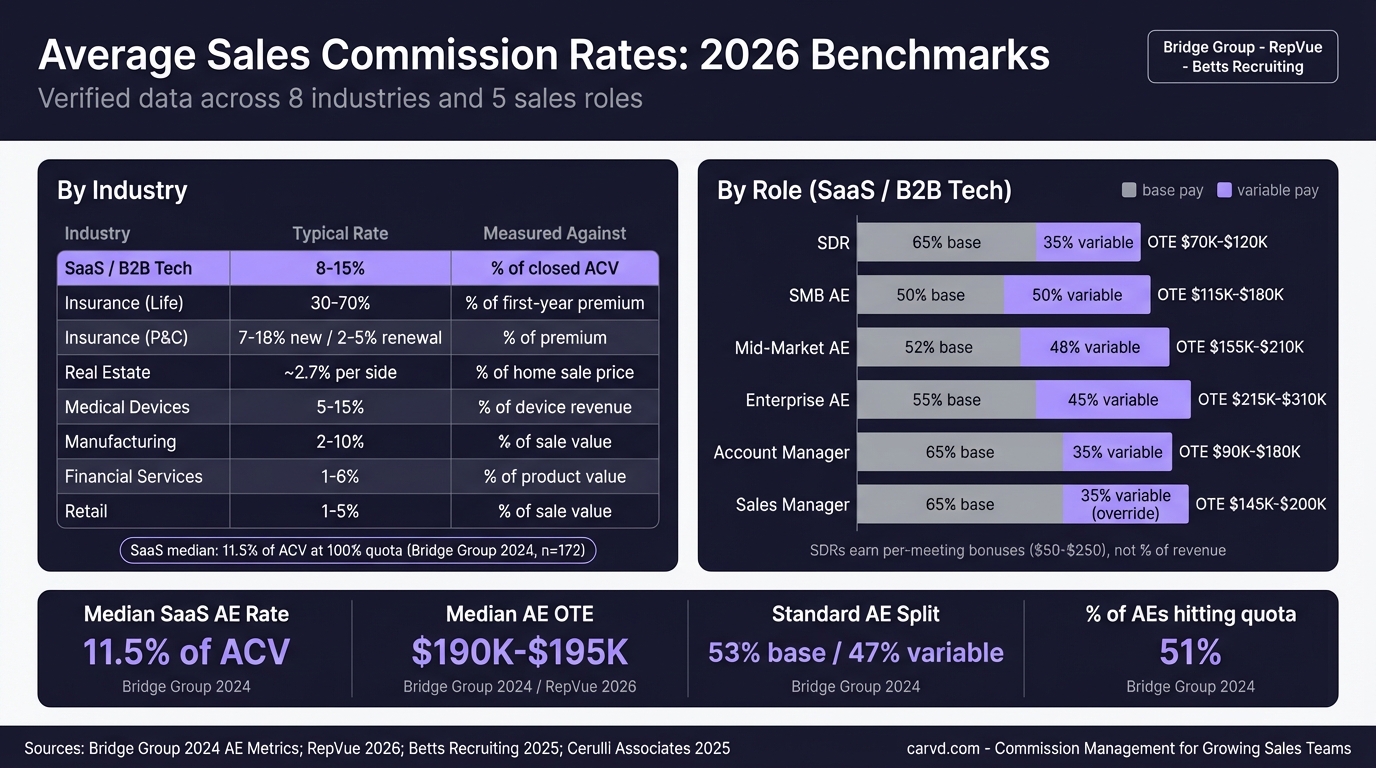
The average sales commission percentage for a B2B SaaS account executive is 11.5% of Annual Contract Value, based on Bridge Group's 2024 benchmark study of 170+ companies. That's the most-cited figure in the industry — and it's a reasonable anchor if you're in SaaS.
But averages obscure more than they reveal. A SaaS SMB rep at 13% and an enterprise rep at 6% are both "average." An insurance agent earning 80% of year-one premium and a retail rep at 2% both represent "normal" for their industries. The useful benchmark isn't a universal average — it's what's typical for your industry, role, deal size, and company stage.
This page synthesizes verified commission benchmarks across nine industries and six sales roles, with data on pay mix, quota-to-OTE ratios, and how commission rates are mathematically derived from OTE and quota.
The short answer: average commission rates at a glance
| Industry | Typical commission rate | Pay mix |
|---|---|---|
| SaaS / Software | 8–15% of ACV (median 11.5%) | 50/50 |
| Real estate | 5.44% total (2.67–2.77% per side) | 100% variable |
| Insurance (life, new) | 55–120% of first-year premium | Largely commission-only |
| Insurance (P&C) | 2–5% new and renewal | Commission + base |
| Financial services | 3–6% transaction; 1% AUM advisory | Shifting to fee-based |
| Pharmaceutical | 5–15% of territory revenue | 60/40 to 70/30 |
| Medical devices | Varies; avg OTE ~$155K | 50/50 to 60/40 |
| Manufacturing / Industrial | 5–15% of net sales | Base + commission |
| Staffing / Recruiting | 15–25% of first-year placed salary | Split of agency fee |
Sources: Bridge Group 2024, Clever Real Estate 2026, Cerulli Associates 2024, MDliaison, MANA, Techneeds 2025
SaaS and software: 8–15% of ACV
For B2B SaaS, Bridge Group's 2024 AE Metrics & Compensation Benchmark — based on 170+ companies surveyed annually — sets the reference point:
- Median commission rate: 11.5% of ACV at 100% quota attainment
- SMB AEs (under $25K ACV): 10–15%
- Mid-market AEs ($25K–$100K ACV): 8–12%
- Enterprise AEs ($100K+ ACV): 5–8%
The rate compresses as deal size grows because absolute payout grows with it. A 6% rate on a $500K enterprise deal pays $30,000 per close — more than a 12% rate on a $50K SMB deal. The math compensates for the lower percentage.
Pay mix: Bridge Group 2024 puts AE pay mix at 53% base / 47% variable — close enough to 50/50 that most plans are built to that standard. ICONIQ's August 2025 GTM Compensation Guide confirms this for growth-stage companies, with SDR splits running 64/36 (more base-heavy, since SDRs don't own the close). You can model how different pay mixes affect total comp using the OTE calculator.
Accelerators: 82% of SaaS companies use accelerated rates above quota, typically stepping up 1.25x–1.5x at 100–110% attainment and 1.5x–2x above 120% (Prowi 2026 analysis of Bridge Group data). Fewer than 15% cap commissions at quota.
Quota-to-OTE ratio: The Bridge Group 2024 median is 4.2x, with a typical range of 3.2x–4.8x. ICONIQ recommends 5x–7x for sustainable unit economics. At 5x and a 50/50 split, a rep's effective commission rate is 10%.
For deeper SaaS benchmarks, see SaaS sales commission rates and tech sales commission.
Real estate: 5.44% total
Real estate commission structure is different from every other industry: the fee is a percentage of a large asset, not of revenue generated by a sales team.
Clever Real Estate's 2026 national survey puts the average total commission at 5.44% — split between the listing agent (2.77%) and the buyer's agent (2.67%). State-level variation runs from 4.86% in Washington to 6.12% in Oklahoma.
The NAR settlement that took effect in August 2024 changed how buyer's agent fees are disclosed and negotiated — buyers must now agree to agent fees directly rather than having them bundled into MLS listings. Despite predictions of compression, rates held relatively stable through 2025.
The economics make the percentage meaningful even at 2.77%: on a $600,000 home, the listing agent's side is $16,620. On a $1.2M home, it's $33,240. The percentage is low; the absolute payout is high.
Insurance: 2–120% depending on product and year
Insurance is the most variable industry for commission rates — deliberately structured to front-load compensation on new business.
Life insurance (independent agents):
- Year 1: 55–120% of the first-year annual premium
- Renewal years 2+: 1–5% of annual premium
A policy with a $3,000 annual premium can generate $1,650–$3,600 in year-one commission for an independent agent. The front-loading creates strong incentive to write new business — and makes renewal income feel almost passive by comparison.
Property and Casualty:
- New business: 2–5% of annual premium
- Renewals: 2–5% of annual premium
P&C commissions are steadier because premiums renew annually and retention matters. An agent who builds a $2M book of business at 3% earns $60,000/year in renewals.
Health insurance:
- 4–10% of annual premium; captive agents often 5–6%
Captive agents (who sell only one carrier's products) typically earn lower rates than independent agents who broker across multiple carriers.
Financial services: shifting to fee-based
Commission-based compensation in financial services has declined substantially. Cerulli Associates (2024) found that more than 72% of financial advisors are now compensated through fee-based models, with commission-based revenue accounting for just 23% of average advisor revenue.
Where transaction commissions still apply:
- Typical transaction commission: 3–6% of transaction value
- AUM-based advisory fees: median 1.02% for a $1M portfolio, declining to ~0.75% at $2M and ~0.50% at $5M+
Broker-dealer payout grids operate on gross dealer concession: the firm keeps a portion and pays the producing rep 20–50% of gross revenue at most wirehouses, up to 80–90% at high-payout independent RIAs.
The regulatory environment (Regulation Best Interest, state fiduciary rules) has accelerated the shift to fee-based models because per-transaction commissions create documented conflicts of interest.
Pharmaceutical: 5–15% of territory revenue
Pharma sales compensation is base-heavy by design. Pay mixes of 60/40 or 70/30 (base:variable) are standard — reps maintain physician relationships through months-long cycles where a single call rarely determines outcome.
Territory-based quotas (market share, prescription volume, units) are more common than deal-level quotas, which is why commission rates in pharma describe a rep's share of territory performance rather than a per-deal percentage.
The BLS May 2024 data puts median total compensation for pharmaceutical sales representatives at $103,600, with commission income averaging approximately $44,798 annually against a strong base.
Medical devices: variable by category; avg OTE ~$155K
Medical device commission rates are difficult to standardize because product categories vary dramatically in deal size, sales cycle, and buyer.
MDliaison's benchmark data puts average total compensation for medical device sales reps at $155,638, with starting compensation for 0–2 years of experience at $98,349. RepVue shows a median OTE of approximately $160,000 (base ~$68,000 + variable ~$92,000).
Pay mix typically runs 50/50 to 60/40 depending on whether reps sell consumables (more variable-friendly, frequent transactions) or capital equipment (longer cycles, more base-heavy).
Specialty areas with the highest earning potential:
- Orthopedic and spine implants (often per-procedure compensation)
- Cardiovascular devices
- Diagnostics equipment
Manufacturing and industrial: 5–15% of net sales
For independent manufacturers' representatives (who sell on behalf of manufacturers on commission-only or draw basis), MANA (Manufacturers' Agents National Association) benchmarks rates at 5–15% of net sales. When calculated on gross margin rather than revenue, independent rep commissions often run 20–40% of margin.
In-house manufacturing sales reps typically earn lower rates (3–8% of revenue) in exchange for salary, benefits, and infrastructure support. Complex custom-engineered products trend toward the high end; commodity goods trend low.
Staffing and recruiting: 15–25% of first-year salary
Recruiting and staffing use a placement fee model rather than a revenue percentage:
- Direct hire (contingent): 15–25% of the placed candidate's first-year salary. Techneeds 2025 data puts the industry average at ~15.84%, with higher-growth agencies averaging 16.91%
- Executive / retained search: 25–31% of projected first-year total compensation, usually with a retainer paid upfront
- Temp staffing: Agencies mark up the worker's bill rate 25–71% (average 35–41%); individual recruiter commissions are a fraction of that markup
A recruiter placing a $130,000 VP of Sales earns their agency $19,500–$32,500 in fees. The recruiter's personal split varies by firm — typically 20–30% of the fee, with production bonuses for volume.
Commission rates by role
Within any industry, role type determines commission structure as much as the industry itself. Here's how SaaS and B2B sales roles typically break down:
| Role | Commission structure | Pay mix (base:variable) | Notes |
|---|---|---|---|
| SDR / BDR | $20–$50/meeting; $100–$250/SQL | 65/35 | Not a % of deal value |
| AE (SMB) | 10–15% of ACV | 50/50 | High rates offset smaller deal sizes |
| AE (mid-market) | 8–12% of ACV | 50/50 | |
| AE (enterprise) | 5–8% of ACV | 55/45 | Lower rate, larger absolute payouts |
| Account manager | 2–5% on renewals; 5–8% on expansion | 65/35 | Expansion at near-new-business rate |
| Sales manager | 2–3% override on team revenue | 65/35 | Modest variable on top of base |
Source: Bridge Group 2024, ICONIQ GTM Compensation Guide August 2025
Why SDRs aren't paid a percentage: SDRs generate pipeline, not closed revenue. Paying them a percentage of deals they sourced but didn't close misaligns incentives — they can't control close rates or deal size. The standard is to pay per qualified meeting or SQL accepted by the AE.
Why managers earn lower percentages: Sales managers earn 2–3% overrides because their primary role is leading and developing the team, not sourcing and closing deals. The override compensates them for enabling team results without creating the same-level incentive to sell personally.
How commission rates are actually set
The most common mistake in commission plan design is setting the commission rate in isolation. The rate isn't a starting point — it's an output of three prior decisions:
Step 1: Determine market OTE for the role. Use Betts Recruiting, RepVue, Bridge Group, or ICONIQ benchmarks for your company stage and segment. Bridge Group 2024 puts median AE OTE at $205,000 for mid-market SaaS (51% base / 49% variable = ~$101K variable).
Step 2: Set a quota-to-OTE ratio. Bridge Group's median is 4.2x for SaaS AEs. ICONIQ recommends 5x–7x for companies targeting healthy unit economics. A 5x ratio means a rep with $200K OTE carries a $1M quota.
Step 3: Choose a base-to-variable split. 50/50 is standard for AEs. If OTE is $200K and the split is 50/50, variable OTE is $100K.
The commission rate follows: Variable OTE ÷ Quota = Commission Rate $100K ÷ $1M = 10%
This is why two companies can both call their plan "competitive" while paying very different rates. A company with aggressive quotas (6x OTE) and a 50/50 split pays effectively ~8.3% on the same OTE. A company with conservative quotas (3.5x OTE) pays ~14.3%. The rate is an artifact of the quota-setting decision.
For a full walkthrough of the formula, see how to calculate commission and commission formula.
Accelerators: what above-quota commission looks like
Most well-designed plans don't stop at the base rate. Once a rep hits quota, they earn at an accelerated rate on every dollar above it.
The standard schedule (SaaS):
- 0–100% of quota: base rate (e.g., 10%)
- 100–110%: 1.25x base rate (12.5%)
- 110–120%: 1.5x base rate (15%)
- 120%+: 2x base rate (20%)
Alexander Group's 2024 survey found 82% of companies use accelerated commissions above quota, with most boosting payouts 20–30% once quota is hit. Fewer than 15% of SaaS companies cap commissions at 100% quota — uncapped plans are the norm, not the exception.
Accelerators do two things: they reward top performers disproportionately (which strong reps expect as a condition of joining), and they concentrate high-cost payouts on reps who are actually generating above-average returns.
For full accelerator mechanics, see tiered commission structure.
What makes commission rates higher or lower
Five factors drive rates across any industry:
Average deal size. Smaller deals require higher percentage rates to generate meaningful rep income. A $2,000 ACV SaaS product at 20% generates a $400 payout per close. A $200,000 enterprise deal at 8% generates $16,000. Rates compress as deal size grows.
Sales cycle length. Longer cycles require more base salary to keep reps financially stable. Pharma reps and enterprise AEs skew base-heavy; high-velocity SMB and insurance reps can tolerate more variable.
Transaction frequency. Insurance renewal commissions are low (1–5%) because they recur annually with minimal additional rep effort. New-business rates are high because acquisition is hard.
Margin structure. Software gross margins (70–80%+) support higher commission rates than manufacturing (15–30%). The company can only pay out what it captures.
Competition for talent. Industries and roles where qualified reps are scarce pay more. Medical device and financial services roles command premium compensation because domain knowledge requirements are high.
Signs your commission rate is wrong
Too low: Reps hitting 100% quota earn less than market OTE for their role. You see voluntary attrition from mid-performers and difficulty recruiting. RepVue's Q4 2024 Cloud Sales Index found overall SaaS quota attainment at just 43% — which means most reps are already earning below their stated OTE variable. A rate that's below market makes this worse.
Too high: The plan is attractive to reps but unsustainable for the business. If your blended commission cost exceeds 15–20% of revenue in a SaaS business with 70%+ gross margins, model whether your CAC payback period holds before rolling it out.
Too complex: Rates that vary by product line, territory, customer tier, deal type, and company stage — combined with accelerators for each — become impossible to track manually. Reps stop trusting the number. Shadow accounting (reps keeping their own parallel spreadsheet) rises. Alexander Group's 2024 survey found 91% of companies planned to redesign comp plans for better pay-for-performance clarity. Simplicity is a design goal, not a compromise. When plans must be complex, a payroll export that ties directly to the calculation engine eliminates the manual handoff where most errors creep in.
Evaluating a commission offer
If you're a sales rep evaluating a new role, the commission rate alone is incomplete information. To evaluate the real earning potential:
- Find out the quota. If OTE is $200K and quota is $2M, the effective rate is 10% (assuming 50/50 split). If quota is $3M, the effective rate is 6.7% on the same OTE.
- Ask about attainment rates. A team where 40% of reps hit quota has a different real OTE than one where 70% hit. RepVue publishes attainment data by company.
- Understand the accelerator. Ask: what do the top 10% of reps actually earn? If the plan is well-designed, the accelerator should push top performers to 1.5x–2x OTE.
- Check deal velocity. A 12% rate on a market with a 9-month sales cycle and $40K average deal means fewer paychecks per year than a 10% rate with 2-month cycles and $25K deals.
For a deeper walkthrough of how to evaluate comp plan design, see sales compensation plan and on-target earnings.
Designing a commission plan: a practical starting point
If you're building a plan from scratch:
- Look up median OTE for the role on Betts Recruiting, RepVue, or Bridge Group for your company stage and segment
- Set quota at 4x–5x OTE for AEs (4.2x is the Bridge Group 2024 median; ICONIQ recommends 5x–7x for sustainable unit economics)
- Use a 50/50 base-to-variable split for AEs
- The commission rate will land around 10–12% — check it against your industry
- Build in accelerators: standard is 1.25x from 100–110%, 1.5x from 110–120%, 2x above 120%
Once you have the structure, commission calculation itself should be automatic. A plan with tiered accelerators, multiple reps, and varying deal types becomes error-prone in spreadsheets and creates the trust problems that drive shadow accounting.
Tools like Carvd calculate commission automatically from your CRM or CSV data — flat plans, tiered structures, and per-product rates — and show every rep exactly how their payout was derived. For teams that have outgrown spreadsheets, that transparency is the difference between a commission process reps trust and one they quietly verify themselves. For a side-by-side comparison with enterprise ICM platforms, see how Carvd compares to Spiff.
Related guides in this cluster
- Sales commission rates by industry: verified benchmarks
- What is a good commission rate?
- Standard commission rate: role-by-role benchmarks
- SaaS sales commission rates
- Tech sales commission rates
- How much commission should I pay?
- Software sales commission rates
- How to calculate commission: formulas and examples
- Tiered commission structure: how it works
- Sales commission structure: types and examples
Last updated: March 23, 2026