OTE Calculator: Estimate On-Target Earnings by Role
Free OTE calculator for sales roles. Calculate total comp from base + commission, evaluate job offers, reverse-engineer quota, and check OTE against role benchmarks.
OTE is the number on every sales job posting, but it rarely comes with an explanation of how it was derived. The Carvd OTE calculator handles three calculations in one place: computing OTE from base and quota, evaluating an OTE stated in a job offer, and reverse-engineering the quota required to hit a target comp.
No signup, no spreadsheet. Enter your numbers and get the answer.
How to use the OTE calculator
The calculator at /tools/ote-calculator has three modes:
| Mode | Use when you want to... |
|---|---|
| Calculate OTE | Find total comp from base salary, commission rate, and quota |
| OTE from Offer | Decode a job offer — given OTE and pay mix, find base, variable, and implied quota |
| Quota from OTE | Reverse-engineer the quota required to hit a target OTE at a given commission rate |
Each mode returns OTE, the variable target, the quota-to-OTE ratio, and an interpretation of whether the numbers are in range for the role.
Calculate OTE from base, rate, and quota
This is the standard calculation for reps who know their comp plan details.
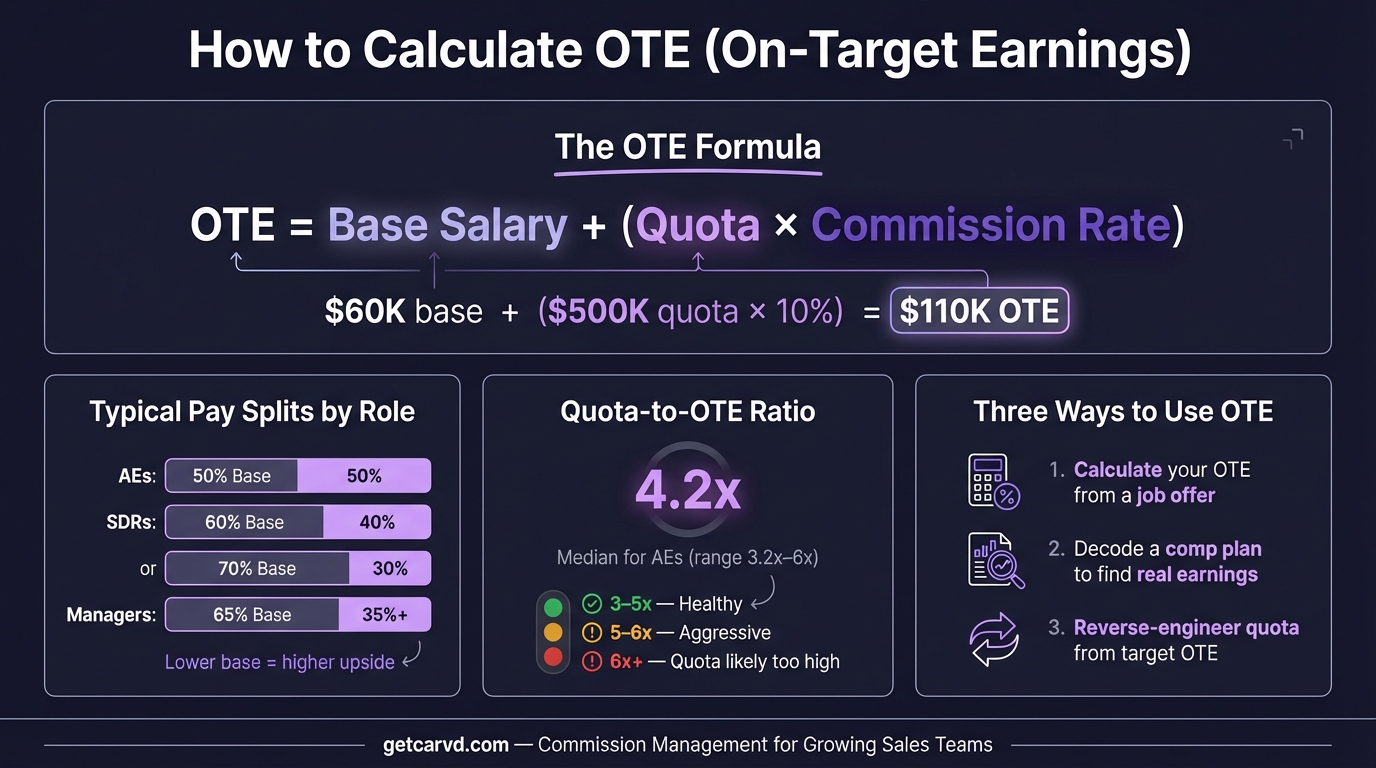
Formula:
OTE = Base Salary + (Annual Quota × Commission Rate ÷ 100)
How to use it: Enter your annual base salary, commission rate (as a percentage), and annual quota. The calculator returns OTE and breaks out the variable component.
Worked example — mid-market AE:
- Base salary: $80,000
- Commission rate: 10%
- Annual quota: $800,000
- Variable target: $800,000 × 10% = $80,000
- OTE: $160,000
The quota-to-OTE ratio here is $800,000 ÷ $160,000 = 5.0x — toward the high end of the normal range for SaaS, but not unusual for mid-market roles.
Worked example — SDR:
- Base salary: $55,000
- Variable target: $30,000 (activity-based, not revenue commission)
- OTE: $85,000
SDRs are typically measured on meetings booked or pipeline generated rather than a revenue commission rate. The calculator handles activity-based variable comp — just enter the target variable directly rather than computing it from a revenue rate.
OTE from offer (decode a job posting)
Job postings state OTE and pay mix, not the underlying quota and commission rate. This mode lets you pull those apart.
Formula:
Base = OTE × Base Percentage
Variable Target = OTE × Variable Percentage
Commission Rate = Variable Target ÷ Annual Quota
How to use it: Enter the stated OTE and pay mix. If you know the quota from the offer, enter it to get the implied commission rate. The calculator flags if the rate looks high or low for the role.
Worked example:
- Stated OTE: $200,000
- Pay mix: 50/50
- Base: $200,000 × 50% = $100,000
- Variable target: $200,000 × 50% = $100,000
- Annual quota: $1,000,000 (if stated in offer)
- Implied commission rate: $100,000 ÷ $1,000,000 = 10%
- Quota-to-OTE ratio: $1,000,000 ÷ $200,000 = 5.0x
A 10% commission rate and 5.0x ratio are both within normal range for an enterprise AE. If an offer doesn't state the quota, ask before accepting — the OTE number means little without knowing how achievable the quota is. According to RepVue's Q4 2024 attainment data, the median SaaS AE attains about 55% of quota, which means most reps earn meaningfully below their stated OTE.
Quota from OTE (reverse calculate)
If you're designing a comp plan and want to work backwards from a target OTE, this mode tells you what quota a rep needs to carry.
Formula:
Required Quota = (OTE − Base Salary) ÷ (Commission Rate ÷ 100)
How to use it: Enter the target OTE, base salary, and commission rate. The calculator returns the annual quota required to hit that OTE and shows the quota-to-OTE ratio.
Worked example — building a plan:
- Target OTE: $150,000
- Base salary: $75,000
- Commission rate: 10%
- Variable target: $150,000 − $75,000 = $75,000
- Required quota: $75,000 ÷ 0.10 = $750,000
- Quota-to-OTE ratio: $750,000 ÷ $150,000 = 5.0x
This is how comp plans should be designed: start with the OTE you want to pay competitive reps, decide the base-to-variable split, and let the quota fall out of the math — rather than setting quota and commission rate independently, which often produces OTEs that are either unaffordable or not competitive.
OTE benchmarks by role
Use these benchmarks to evaluate whether an OTE is competitive for a given market and seniority level. Ranges reflect US market data as of 2025.
| Role | OTE Range | Average OTE | Typical Pay Mix |
|---|---|---|---|
| SaaS SDR / BDR | $60K–$95K | $78K | 65/35 base:variable |
| SaaS AE (Mid-Market) | $150K–$220K | $180K | 50/50 |
| SaaS AE (Enterprise) | $220K–$350K | $280K | 50/50 |
| SaaS Account Manager | $100K–$160K | $130K | 60/40 |
| Financial Services AE | $120K–$250K | $175K | 55/45 |
| Medical Devices AE | $150K–$280K | $200K | 50/50 |
| Manufacturing AE | $80K–$150K | $110K | 60/40 |
| Insurance Agent | $50K–$120K | $80K | 70/30 |
Sources: Bridge Group 2024 SaaS AE Metrics & Compensation Benchmark Report; Pavilion 2025 Compensation Report; Betts Recruiting 2025 Salary Guide.
SaaS OTEs have compressed slightly since 2022. The Bridge Group's 2024 study of 172 B2B SaaS companies found median AE OTE at $186K — down from $205K at the peak. If a role's stated OTE is significantly above these benchmarks, verify the quota is achievable before accepting. For teams already running plans, Carvd's rep dashboards show each rep how their actual earnings track against OTE in real time.
The quota-to-OTE ratio: the number that matters most
OTE is only meaningful relative to the quota required to earn it. A $200K OTE on a $500K quota is very different from a $200K OTE on a $2M quota.
Quota-to-OTE ratio = Annual Quota ÷ OTE
Bridge Group's 2024 benchmark puts the median at 4.2x for SaaS AEs. The calculator displays this ratio automatically and interprets it:
| Ratio | Interpretation |
|---|---|
| Below 3x | Quota may be easy to hit; plan could be expensive to sustain |
| 3x–5x | Normal range for most SaaS AE roles |
| 5x–6x | High but manageable for enterprise or complex sales |
| Above 6x | Structurally difficult; most reps will miss quota |
A ratio above 6x doesn't automatically make an offer bad — if the company has strong pipeline support, a short sales cycle, and inbound leads, higher quota is achievable. But it's the first question to ask when a stated OTE looks attractive but the underlying math seems off.
Calculating OTE with accelerators
OTE is defined at 100% quota attainment, but most plans pay more for overperformance. Accelerators change the commission rate above certain thresholds.
A common SaaS accelerator structure:
- 0–99% of quota: 8% commission rate
- 100%–125%: 12%
- Above 125%: 15%
For an AE with $800K quota and $1M in closed revenue:
- First $800K at 8% = $64,000
- Next $200K at 12% = $24,000
- Total variable = $88,000
The stated OTE might be based on $80K variable (10% flat on $800K quota), but the accelerator structure changes what above-quota performance actually pays. If you're evaluating an offer with accelerators, ask for the full rate table — not just the base rate used to calculate OTE.
For modeling accelerators at different attainment levels, the commission plan builder shows OTE projections at 80%, 100%, and 120% attainment with full accelerator modeling.
Year-one OTE vs. fully ramped OTE
New reps don't earn full OTE in year one. Bridge Group's 2024 data puts average SaaS AE ramp time at 5.7 months. Ramp period comp is typically reduced quota, a draw against commission, or a guaranteed base-only period.
A simple ramp-adjusted estimate:
Year-one OTE = Base + Ramp variable + Full-quota variable
Example for a rep with $80K base, $80K variable target, ramping at 50% for months 1–3:
- Ramp variable (months 1–3): 50% × 3/12 × $80,000 = $10,000
- Full-quota variable (months 4–12): 9/12 × $80,000 = $60,000
- Year-one estimate: $80,000 + $10,000 + $60,000 = $150,000
That's $10,000 less than stated OTE of $160,000 — and that's assuming the rep hits full quota in months 4–12, which is optimistic. A realistic year-one estimate for a SaaS AE might be 80–90% of stated OTE, depending on ramp structure and deal cycle.
When a calculator is enough — and when it isn't
The OTE calculator handles one-off math well. It doesn't handle ongoing commission management.
When a rep asks "what's my projected payout this quarter," the answer requires knowing which deals closed, which plan applies, whether there's a quarterly ramp reset, and whether any deals were excluded or clawed back. That's not a calculator problem — it's a tracking and attribution problem.
Finance teams running commission calculations manually spend 10+ hours per month on the process. At 15+ reps or multiple plan types, the manual calculation tree becomes error-prone, and reps start building their own shadow accounting in personal spreadsheets.
Carvd automates commission calculations from your CRM data, shows reps the deal-by-deal breakdown behind every payout, and lets sales ops run a complete commission calculation in one click instead of rebuilding a spreadsheet each period. When the cycle is done, the payroll export generates a payroll-ready CSV in one click.
Related tools and guides
Tools:
- Sales Commission Calculator — Calculate flat, tiered, base + commission, and split commissions
- Commission Plan Builder — Model plans at 80%, 100%, and 120% attainment
- Commission Rate Benchmarks — Look up typical commission rates by industry and role
Guides:
- How to Calculate OTE — Full walkthrough including pay mix, accelerators, and ramp
- On-Target Earnings: The Complete Guide — What OTE means, how it's set, and how to evaluate it
- OTE vs Base Salary — How the base-to-variable split affects rep behavior and comp design
- Variable Compensation — How variable pay fits into the broader compensation structure
- Sales Commission Calculator — Full guide to the commission calculator tool
Last updated: March 22, 2026