How to Calculate Sales Commission (Formulas + Examples)
Step-by-step commission calculation for flat rate, tiered, per-product, and accelerator plans. Includes worked examples and the formulas sales ops teams actually use.
Calculating sales commission is either a two-minute formula or a multi-hour spreadsheet problem, depending on how your comp plan is structured. This guide covers both: the math for every common plan type, with worked examples you can apply directly.
The inputs you need before calculating
Every commission calculation starts with the same three elements:
- Revenue base — the dollar amount the commission is applied to. This is usually deal value (ACV), closed revenue, or collected revenue, depending on your plan design.
- Commission rate — the percentage paid per dollar of revenue. According to the Bridge Group's 2024 SaaS AE Metrics & Compensation Benchmark Report (a survey of 170+ B2B SaaS companies), the median commission rate is 11.5% of ACV, with a typical range of 11%–14%.
- Quota — only required if your plan uses accelerators or decelerators. Quota is the threshold at which the rep's base rate kicks in or changes.
If your plan uses accelerators, add a fourth element:
- Quota attainment — what percentage of quota the rep has reached. RepVue's Cloud Sales Index for Q4 2024 put average quota attainment across all roles at 43%, which is why comp plan designers build accelerators: most reps earn at or below quota rate most of the time.
Flat-rate commission formula
The simplest plan type. One rate, applied to all revenue.
Formula:
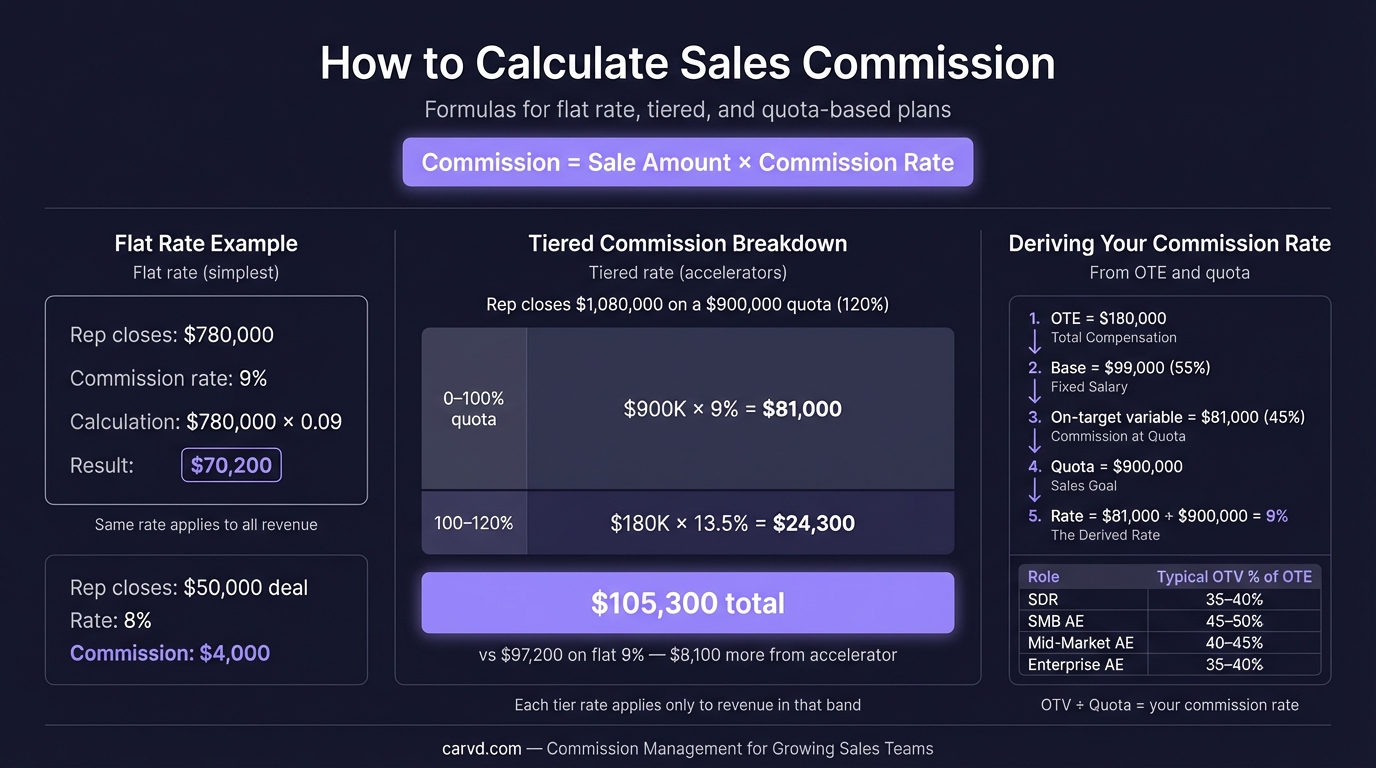
Commission = Revenue × Rate
Example:
A rep closes $95,000 in Q1. Their commission rate is 10%.
$95,000 × 0.10 = $9,500
That's it. Flat-rate plans are easy to calculate and easy for reps to verify — or you can automate it entirely with a commission calculator that handles tiers, splits, and accelerators alongside flat-rate math. The downside is they don't reward above-quota performance — the rate is the same whether the rep hits 70% of quota or 130%.
Tiered commission formula
Tiered plans pay increasing rates as revenue crosses defined thresholds. The key rule: each rate applies only to the revenue within that tier, not to total revenue.
This is where most commission spreadsheet errors happen. The common mistake is applying the highest achieved rate to all revenue, which overpays reps in higher tiers.
Formula:
Tier commission = Revenue in tier × Tier rate
Total commission = Sum of all tier commissions
Example:
Commission tiers:
- 0%–$50,000: 8%
- $50,001–$100,000: 12%
- Above $100,000: 15%
Rep closes $130,000 in the month.
| Tier | Revenue in tier | Rate | Commission |
|---|---|---|---|
| First $50,000 | $50,000 | 8% | $4,000 |
| $50,001–$100,000 | $50,000 | 12% | $6,000 |
| Above $100,000 | $30,000 | 15% | $4,500 |
| Total | $130,000 | — | $14,500 |
The blended effective rate here is $14,500 ÷ $130,000 = 11.15% — lower than the top tier rate because only the revenue above the tier thresholds earns the higher rate.
If you applied 15% to all $130,000 (the common mistake), you'd get $19,500 — an overpayment of $5,000.
Per-product commission formula
Some plans pay different rates depending on the product or service sold. New product lines, strategic upsells, and high-margin SKUs often carry higher rates.
Formula:
Commission = (Revenue_A × Rate_A) + (Revenue_B × Rate_B) + ...
Example:
A rep sells:
- $60,000 of Product A (core platform, 10% rate)
- $25,000 of Product B (add-on module, 15% rate — higher because the company wants to push attach)
- $15,000 of services (5% rate — lower margin)
Commission = ($60,000 × 0.10) + ($25,000 × 0.15) + ($15,000 × 0.05)
           = $6,000 + $3,750 + $750
           = $10,500
Per-product plans create calculation complexity fast. With three products and ten reps, that's thirty separate calculations per pay period before you even factor in quota attainment. A commission spreadsheet template can help organize the inputs before you outgrow manual tracking.
Accelerator commission formula
Accelerators pay a higher rate on revenue above quota. They're designed to reward over-performance without raising the base rate for all revenue.
Formula:
Below-quota commission = Quota revenue × Base rate
Above-quota commission = (Actual revenue − Quota) × (Base rate × Accelerator multiplier)
Total commission = Below-quota + Above-quota
Example:
- Quota: $100,000/month
- Base rate: 10%
- Accelerator: 1.5x above 100% quota
- Actual revenue: $130,000
Below-quota commission = $100,000 × 0.10 = $10,000
Above-quota revenue = $130,000 − $100,000 = $30,000
Effective above-quota rate = 10% × 1.5 = 15%
Above-quota commission = $30,000 × 0.15 = $4,500
Total commission = $10,000 + $4,500 = $14,500
Some plans use a stepped accelerator: 1.25x at 100%–120% of quota, 1.5x at 120%–150%, 2x above 150%. In that case, apply the formula for each attainment band separately and sum the results, the same way tiered commissions work.
Combining plan types: a full worked example
Most real comp plans combine elements. Here's a complete calculation for a rep with a tiered plan that includes per-product rates and an accelerator.
Plan design:
- Product A (core): tiered — 8% on first $75K, 12% above $75K
- Product B (add-on): flat 14%
- Quota: $100,000 total revenue
- Accelerator: 1.3x on all commission when rep exceeds 100% of quota
Rep results for the period:
- Product A revenue: $80,000
- Product B revenue: $30,000
- Total revenue: $110,000 (110% of quota)
Step 1: Calculate base commissions
Product A (tiered):
- First $75,000 at 8% = $6,000
- Remaining $5,000 at 12% = $600
- Product A commission = $6,600
Product B (flat):
- $30,000 at 14% = $4,200
Step 2: Sum before accelerator
$6,600 + $4,200 = $10,800
Step 3: Apply accelerator
Rep hit 110% of quota, so the 1.3x accelerator applies to all commission.
$10,800 × 1.3 = $14,040
Total payout: $14,040
Without the accelerator, this rep would have earned $10,800. The accelerator adds $3,240 for driving $10,000 above quota — 32.4% more commission for 10% more revenue. That's the design intent: make over-quota revenue more valuable to the rep.
Where commission calculations break down
The math isn't hard. The problem is data and scale.
According to Palette HQ's 2023 State of Sales Compensation report, 56% of companies experience commission errors on a regular basis. The errors don't usually come from wrong formulas — they come from:
- Reps not knowing which plan applies to them. Multiple plan versions, mid-year updates, or overlapping territories create ambiguity.
- Incomplete deal data. Missing close dates, incorrect deal amounts, or unmatched product codes break per-product calculations.
- Manual data entry. Every time someone copies numbers between systems — CRM to spreadsheet, spreadsheet to payroll — is an opportunity for error.
- Timing mismatches. A deal closed December 31 that's exported January 2 lands in the wrong pay period.
For a team of 5–8 reps on a simple flat-rate plan, a spreadsheet handles all of this fine. When plan complexity increases — multiple plan types, per-product rates, overlapping territories, mid-year amendments — the spreadsheet becomes the source of errors rather than the solution.
Only 24% of sellers can easily calculate their own total variable compensation, according to Gartner data cited in Xactly's sales statistics research. The other 76% are either trusting the payout or tracking it themselves in a separate spreadsheet. Giving reps access to rep dashboards with deal-by-deal breakdowns eliminates the need for shadow accounting entirely.
Checking your work
Before finalizing any commission run, validate against three numbers:
- Blended effective rate — total commission paid ÷ total revenue. For a SaaS AE team, this should be close to 10%–14% if your plan is calibrated to market benchmarks. An effective rate well above or below that range signals a calculation error or an off-market plan design.
- Per-rep reasonableness check — does each rep's payout make sense given what you know about their quarter? A rep who had a strong month shouldn't show a lower payout than a weaker performer on the same plan.
- Quota attainment distribution — does the distribution of attainment across the team look normal? A cluster of reps at exactly 100% sometimes signals a calculation error that's capping or flooring payouts incorrectly.
For automated calculation with deal-by-deal breakdowns, tools like Carvd apply the formulas above to your CRM data and show reps exactly how each payout was derived — so you spend time checking results rather than building them. For a side-by-side look at how this compares to enterprise ICM platforms, see how Carvd compares to Spiff.
For a full breakdown of how different commission structures work, see our sales commission structure guide. If you're building a tiered plan from scratch, tiered commission structure covers design decisions and common mistakes in detail.
Related reading:
Last updated: March 22, 2026