Software Sales Commission Rates: Benchmarks by Role and Segment
Software sales commission rates range from 5% to 15% of ACV for AEs. Here are verified benchmarks by role, company type, and the structural difference between SaaS and on-premise.
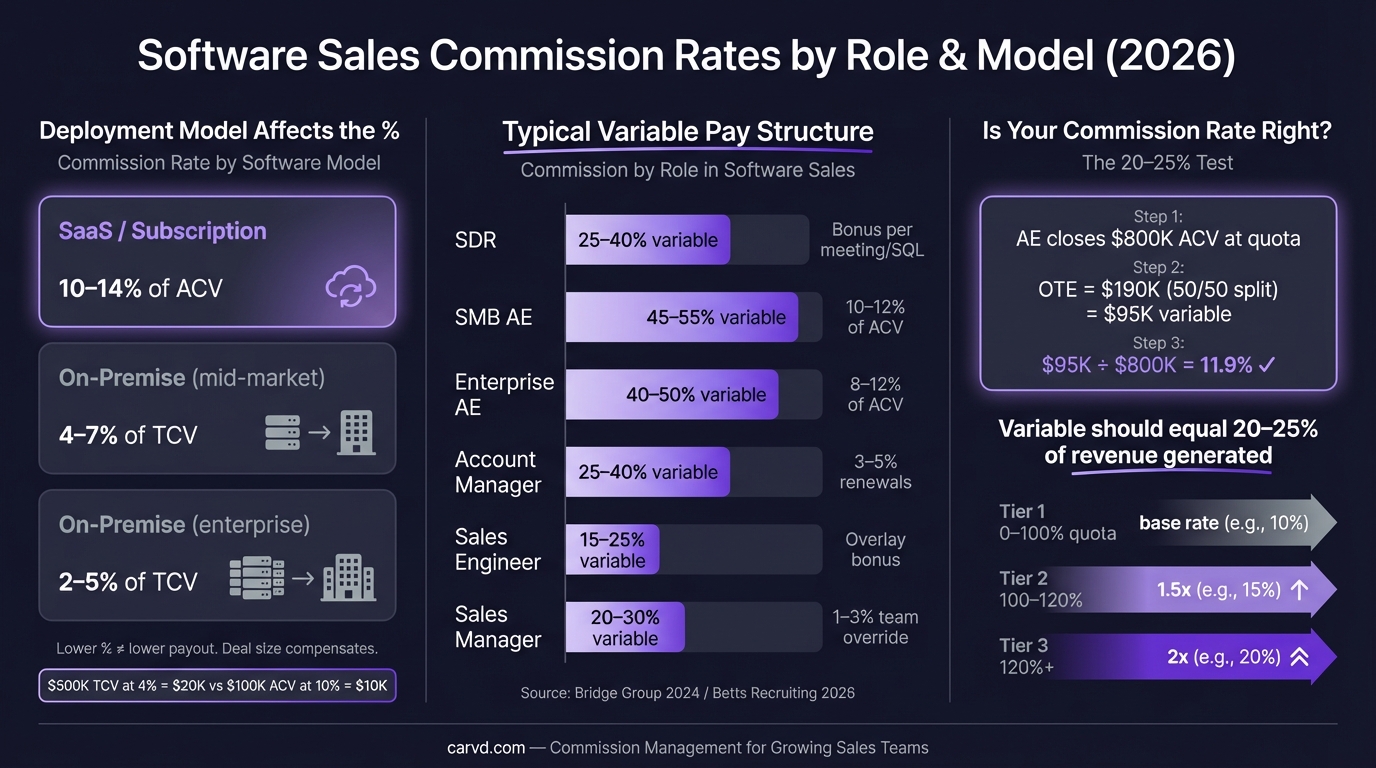
Software sales commission rates depend heavily on one variable most job postings don't mention: whether the product is sold as a subscription or a perpetual license. The two models pay very differently, even when the rates look similar on paper.
For SaaS AEs, the industry benchmark is 11.5% of Annual Contract Value at 100% quota attainment (Bridge Group 2024, 172 B2B SaaS companies). For enterprise AEs at large legacy software vendors like Oracle or IBM, the rate is lower — typically 5–8% — but quota sizes are much larger, so absolute payouts are comparable or higher.
Here's how software sales commission rates break down across roles, company types, and deal structures.
SaaS commission rates vs. on-premise software
The single biggest structural difference in software sales compensation is the contract model.
SaaS / subscription software:
- Commission is paid on Annual Contract Value (ACV) or Annual Recurring Revenue (ARR)
- Median rate: 11.5% of ACV at 100% quota (Bridge Group 2024)
- Renewal commissions: typically 2–5% (ICONIQ GTM Guide 2025), paid to incentivize retention
- Multi-year deals: many companies pay a reduced credit (e.g., 20% of Years 2–3 ACV) in the year of signing
On-premise / perpetual license software:
- Commission is paid on the full upfront license fee at close
- A $2M license deal generates the full commission check at signing — there's no ACV split
- Maintenance/support contracts at 15–20% of license value were often excluded or paid at lower rates
- Pay mix skewed base-heavy (60/40 or 70/30 base:variable) because sales cycles stretched months to years
The economic logic is different. A $5M perpetual license deal might generate $250K–$500K in commission at close. The same deal as a SaaS contract at $1.2M ARR generates $138K in year-one ACV commission at 11.5% — but with renewal tail payments each year. The SaaS model earns the same commission but spread over time, which is why SaaS companies compensate for this with accelerators above quota.
Commission rates by role
| Role | Commission rate | OTE range | Pay mix |
|---|---|---|---|
| SDR / BDR | Per-meeting ($20–$50); per SQL ($100–$250) | $70K–$100K | 65/35 base:variable |
| AE (SMB) | 10–15% of ACV | $105K–$140K | 50/50 |
| AE (mid-market) | 8–12% of ACV | $140K–$180K | 50/50 |
| AE (enterprise) | 5–8% of ACV | $180K–$250K+ | 55/45 to 60/40 |
| Sales Engineer | $150K–$200K base; variable usually tied to quota attainment | $180K–$250K | 70/30 to 80/20 |
| Account Manager | 5–10% on renewal/expansion ACV | $130K–$190K | 65/35 |
| Sales Manager | 2–3% override on team revenue | $160K–$200K | 65/35 |
Sources: Bridge Group 2024, Betts Recruiting 2026, ICONIQ GTM Guide August 2025, Seattle Corporate Search 2025
Sales Engineers are the notable exception — they're compensated primarily on base salary because their incentive is tied to product fit and deal quality rather than volume. Most SE variable comp is structured as a multiplier tied to the AE's quota attainment rather than a direct commission percentage.
Enterprise software vendors vs. smaller SaaS companies
Enterprise software vendors (Oracle, IBM, SAP, Salesforce, Microsoft) structure compensation differently than growth-stage SaaS companies.
Oracle: Mid-market AEs operate on a 50/50 base-to-variable split, approximately $200K OTE, with a $1M ACV quota.
IBM: Historically used 70/30 or 55/45 base-heavy structures for account executives, with protected quota periods (guaranteed variable for the first year) to manage long new-hire ramp times. The higher base reflects IBM's longer sales cycles and named-account territory model.
Growth-stage SaaS companies: 50/50 split is standard, with smaller quotas ($500K–$800K ACV) and more aggressive accelerators above quota to reward top performers.
The pattern is consistent: larger deal sizes and longer cycles push structures toward more base. Shorter cycles and smaller deal sizes push toward more variable. A 70/30 split at IBM makes sense when a single deal takes 18 months to close. A 50/50 split at a high-velocity SMB SaaS company makes sense when an AE closes 10–15 deals per month.
Commission rates by segment
Deal size is the primary driver of rate, not company name or industry label.
| Segment | Commission rate | Typical quota | OTE |
|---|---|---|---|
| SMB software AE (under $50K ACV) | 10–15% | $300K–$600K | $105K–$140K |
| Mid-market AE ($50K–$250K ACV) | 8–12% | $600K–$1M | $140K–$180K |
| Enterprise AE ($250K+ ACV) | 5–8% | $1M–$3M+ | $180K–$250K+ |
| Enterprise AE at large vendor (Oracle-tier) | 4–8% | $1M–$5M+ | $200K–$370K |
The inverse relationship between deal size and rate is intentional. A 5% commission on a $300K enterprise deal is $15,000. A 5% rate on a $30K SMB deal is $1,500 — not enough to sustain motivation or income on typical close rates. Rate and deal size are calibrated to produce similar absolute payouts across segments. You can verify this by modeling different segment rates in the commission plan builder and comparing projected OTE at each attainment level.
Accelerators above quota
Most software companies use commission accelerators above quota to reward overachievement:
- 100–125% attainment: 1.5x base commission rate
- 125–150% attainment: 2x base commission rate
- 150%+: 2–5x on overachievement revenue (less common; some companies cap here)
At an 11.5% base rate, a rep at 130% quota attainment earns approximately 23% commission on revenue above the 100% line. This is where high performers generate disproportionate income — and why accelerator design matters as much as base rate design.
Caps on commission are uncommon in software sales. Fewer than 15% of SaaS companies cap commissions at quota attainment (Prowi 2026 analysis). Caps remove incentive for above-quota performance, which is when the company's sales cost per dollar of revenue is lowest.
Quota attainment reality
The commission rates above assume 100% quota attainment. In practice:
- 51% of SaaS AEs hit quota in 2024, down from 66% in 2022 (Bridge Group 2024)
- The median AE earns commission on less than their full quota
- Accelerator income concentrates in the top quartile of the sales team
This has real implications for how comp plans should be designed. If you're setting quotas, the Alexander Group recommends that 60–70% of reps should hit their number in a healthy compensation environment. The current 51% attainment rate across the SaaS industry suggests many companies have over-indexed on quota growth relative to what the market supports.
A compensation plan where half the field never reaches the accelerator tiers demotivates rather than motivates. Some companies respond by adding a "ramp" tier at 75–85% attainment with a small accelerator just to reward progress. Carvd's commission calculator shows each rep their tier progress in real time, so they can see exactly how close they are to the next accelerator.
Renewal and expansion commission
New logo and renewal commission rates are almost always different:
- New logo / new ARR: 10–15% (SMB), 5–8% (enterprise)
- Renewal commission: 2–5% of renewed ACV — lower to reflect that renewals require less acquisition effort than new business
- Expansion / upsell: typically the same rate as new logo for the incremental ACV
Companies where the same AE owns both new business and renewals usually set renewal rates at 4–5% to give reps incentive to protect the install base without cannibalizing their prospecting time with low-value renewal calls.
How to track software commission accurately
Software commission plans get complex quickly. Tiered rates, multi-year contracts with credit modifiers, separate new logo vs. renewal rates, and team quota overrides for managers all create edge cases where spreadsheet-based tracking breaks.
Most teams start tracking commissions in Excel. It works until you have more than one plan type, an AE who also handles renewals, or a manager asking for an override. Tools like Carvd automate commission calculations from your CRM data and show reps exactly how their payout was derived for every deal — no back-and-forth with finance required. For a side-by-side comparison of software commission platforms, see how Carvd compares to Xactly.
For SaaS-specific benchmarks in more depth, see SaaS sales commission rates: what's standard in 2026.
For the full benchmark reference across industries, see the average sales commission percentage guide — the pillar for this cluster.
Related reading:
Last updated: March 23, 2026