Sales Operations Manager Salary: What RevOps Leaders Earn
Sales ops managers earn $95K–$115K base with 10–20% variable tied to operational metrics. Full benchmarks by experience, company size, and career stage.
Sales operations managers earn a median base salary of $95,935, with total cash compensation in the $110,000–$130,000 range nationally, per PayScale's February 2026 data across 912 profiles. Built In's data sits higher at $108,319 average base and $124,804 total compensation.
That spread is real, not noise. A sales ops manager at a 40-person Series A and one at a 2,000-person public company carry identical titles. The pay difference between them can exceed $50,000 — driven by company size, experience, whether the role owns comp plan design, and whether the job is titled "Sales Ops" or "RevOps."
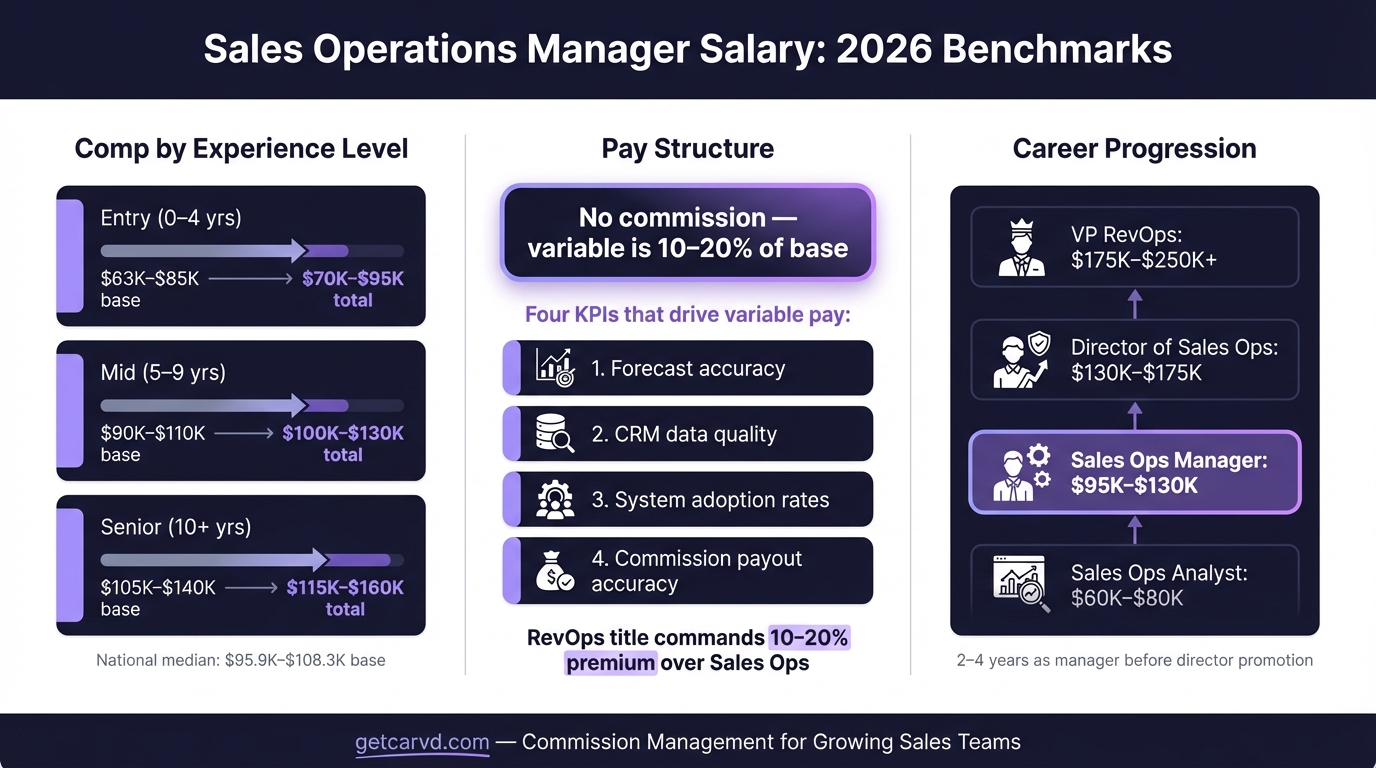
The variable pay structure is also distinct from every other sales-adjacent role. Sales ops managers don't carry quota. They don't earn commission on closed revenue. Their 10–20% variable is tied to operational outcomes: forecast accuracy, CRM data quality, system adoption rates, commission payout accuracy. Understanding that structure matters as much as the base number.
What sales ops managers earn: base, total cash, and pay mix
The range for US-based sales operations managers in 2026:
| Level | Base salary | Total cash |
|---|---|---|
| Entry / early career (0–4 years) | $63,000–$85,000 | $70,000–$95,000 |
| Mid-level manager (5–9 years) | $90,000–$110,000 | $100,000–$130,000 |
| Senior manager (10+ years) | $105,000–$140,000 | $115,000–$160,000 |
| National median (manager title) | ~$99,000 | ~$115,000 |
Sources: PayScale February 2026 (912 profiles), Revenue Operations Alliance benchmarks, Cirra.ai RevOps Salary Benchmarks 2025.
Pay mix for a non-quota-carrying ops role is base-heavy. Typical split: 85–90% base / 10–15% variable. Senior managers and directors approach 80/20. Compare that to the 50/50 base-variable split standard for account executives — sales ops compensation is built differently because the output is process quality, not revenue.
Total cash is where the tech sector shows a sharp premium. Levels.fyi data from March 2026 (30 RevOps manager samples) shows median total comp of $172,250 with a $160,000 median base. Top-paying companies on PayScale: Google ($154,913), Amazon ($147,518), Alteryx ($129,331). These figures reflect the tech industry premium and shouldn't be applied to a 50-rep SaaS company's comp benchmarking.
How variable pay is structured for sales ops managers
This is where sales ops comp diverges from every quota-carrying role. Variable pay for sales ops managers is tied to operational and organizational metrics — not individual bookings.
Common structures, in order of prevalence:
Annual performance bonus (most common): 10–15% of base, paid annually or semi-annually. Tied to company-level metrics (ARR growth, churn reduction) or ops-specific KPIs (forecast accuracy within 5%, commission error rate below 1%, CRM data completeness above 90%). This is what most Series B+ companies use.
Quarterly bonus: more common at mature companies with formal OKR cycles. Tied to cross-functional deliverables: launching a new comp plan structure on schedule, reducing commission dispute rate by X%, completing a CRM migration. Typically 3–5% of base per quarter at target.
MBO (management by objectives): negotiated goals set at the start of each review period, each with a defined payout. More flexible than preset metrics; more subjective in practice. Common at enterprise companies.
Equity: at growth-stage and public companies, RSUs or options add meaningful upside beyond cash. Early-stage startups frequently use equity to offset below-market cash, especially at the manager level.
Sales ops managers are almost never on individual sales commission. If you see a job posting where the OTE includes commission tied to closed revenue, that's either a hybrid SDR/ops role or a posting error worth investigating before accepting.
For context on how quota-carrying commission structures work — which sales ops teams design and manage — see sales compensation plan design and variable compensation types.
Benchmarks by company size
Company size explains more of the sales ops salary variance than almost any other factor. Cirra.ai's RevOps benchmarks show employees at companies with 1,000+ headcount earning roughly 62% more than those at sub-50-person startups in equivalent roles.
| Company size | Base range | Notes |
|---|---|---|
| Seed / pre-Series A (under 50 employees) | $75,000–$95,000 | Equity offsets lower cash; ops team is often 1 person |
| Series A–B (50–200 employees) | $90,000–$110,000 | Formalizing processes; comp plan ownership starts here |
| Series B–C (200–500 employees) | $100,000–$125,000 | Multiple ops managers, specialization increases |
| Mid-market (500–2,000 employees) | $115,000–$140,000 | Cross-functional scope; director track accelerates |
| Enterprise (2,000+ employees) | $130,000–$175,000 | Structured levels, formal comp bands, higher bonus targets |
At early-stage companies, the sales ops manager often owns everything: CRM administration, comp plan calculation, quota setting, territory design, and reporting. The breadth is real — and so is the equity upside if the company grows. At enterprise, the role specializes: one person owns comp, another owns the tech stack, another owns forecasting.
Career progression and salary path
| Level | Base range | Total cash | Typical timeline |
|---|---|---|---|
| Sales Ops Analyst / Specialist | $55,000–$80,000 | $60,000–$90,000 | 0–3 years in role |
| Sales Operations Manager | $90,000–$120,000 | $100,000–$140,000 | 2–5 years in role |
| Senior Sales Ops Manager | $110,000–$140,000 | $120,000–$160,000 | 3–6 years in role |
| Director of Sales Operations | $130,000–$175,000 | $150,000–$210,000 | 3–5 years in role |
| VP of Sales Operations / RevOps | $175,000–$250,000+ | $200,000–$350,000 | 5+ years leadership |
Salary growth in revenue operations runs approximately 5% year-over-year, ahead of the 3–4% general market average. The jump from manager to director is the most significant inflection point — a 20–35% base increase at promotion is typical when the scope jump is real, not just a title change.
The biggest single salary accelerator in this path isn't tenure — it's owning commission plan design and forecasting. PayScale data shows sales ops managers with compensation plan design responsibility earning a median of $111,611, compared to $93,000–$95,000 for those focused on CRM administration. Tools like the comp plan builder streamline that design work — modeling flat, tiered, and accelerator structures before rolling them out.
The RevOps title premium
"Sales Operations Manager" and "Revenue Operations Manager" describe overlapping but distinct roles. The RevOps title signals broader GTM ownership — marketing ops, customer success ops, and sales ops in a unified function.
The pay difference is consistent: RevOps titles command a 10–20% premium over Sales Ops for equivalent levels. Revenue Operations Alliance benchmarks put the average Revenue Operations Manager base at $97,749 — but this includes roles across different experience bands. Cirra.ai's data, segmented by years of experience, shows the RevOps premium becoming more pronounced at senior levels.
If you're evaluating an offer, the title difference matters less than what the role actually owns. A "Sales Operations Manager" who owns comp design, forecasting, and tech stack across three functions is effectively doing RevOps work — and should be compensated accordingly.
Geography
Location affects sales ops salary, though the spread is narrower than in quota-carrying sales roles.
| Market | Average base | vs. national |
|---|---|---|
| San Francisco / Bay Area | $134,000–$143,000 | +25–32% |
| Boston / NYC | $130,000–$140,000 | +20–28% |
| Seattle | $120,000–$130,000 | +12–20% |
| Austin / Denver | $105,000–$115,000 | Near national average |
| Remote | $130,000–$151,000 reported | Survivor bias applies |
Remote salary data skews high because remote roles disproportionately exist at larger, better-paying companies. The $151,270 average remote figure from Built In reflects that bias. A more defensible range for a remote sales ops manager is $100,000–$130,000 base, depending on company size and scope.
Evaluating a sales ops manager offer
The headline base matters less than three things that often go unasked:
1. What does the variable actually pay for? Ask to see the bonus target breakdown. "Company performance" is vague. "Forecast accuracy within 5% for 3 consecutive quarters" tells you exactly what you're being measured on.
2. Does the role include comp plan ownership? Owning commission plan design isn't just extra responsibility — it's a $10,000–$15,000 compensation premium in the market. If you're doing that work, negotiate for it explicitly.
3. What's the actual scope vs. the posted scope? Sales ops manager roles at growing companies expand significantly within 12 months. A role that starts as CRM administration often evolves into owning comp, forecasting, and territory planning. Understanding where the company is on that trajectory helps you calibrate both pay expectations and workload.
For context on how sales ops managers fit into the broader compensation picture — and how the comp plans they design translate to actual rep earnings — see sales manager compensation benchmarks, SDR salary benchmarks, and tech sales salary by role.
As the role expands to include forecasting and territory planning, you'll be presenting ops metrics to leadership regularly — Deckary helps build those decks. Commission tracking software like Carvd is often the responsibility of sales ops managers — running commission cycles with the commission calculator, maintaining plan accuracy, handling disputes, and generating payroll exports. Understanding the tooling your team relies on is part of the job.
Salary data sourced from PayScale Sales Operations Manager Salary data (February 2026, 912 profiles), Built In US Salary Data, Glassdoor Salary Reports, Revenue Operations Alliance Salary Benchmarks, Cirra.ai RevOps Salary Benchmarks 2025, Levels.fyi Revenue Operations compensation data (reviewed March 2026), and Comparably Sales Operations Manager compensation data.
Last updated: March 23, 2026