Account Executive Salary & Commission: 2026 Benchmarks
Account executive OTE ranges from $135K–$270K+ depending on segment and stage. Benchmarks for base, variable pay mix, commission rates, and how to evaluate AE comp offers.
Most salary content for account executives stops at "here's the median from Indeed." That number isn't wrong — it's just not the question that matters for sales leaders or AEs making comp decisions.
The questions that actually matter: What portion of AE comp should be variable? How does OTE scale by company stage and deal segment? What's a reasonable quota-to-OTE ratio? And what separates an AE offer worth taking from one that looks good on paper but won't pay out?
This guide is built around those questions.
What account executives actually earn: salary and OTE benchmarks
Before using any number, understand which market you're benchmarking against.
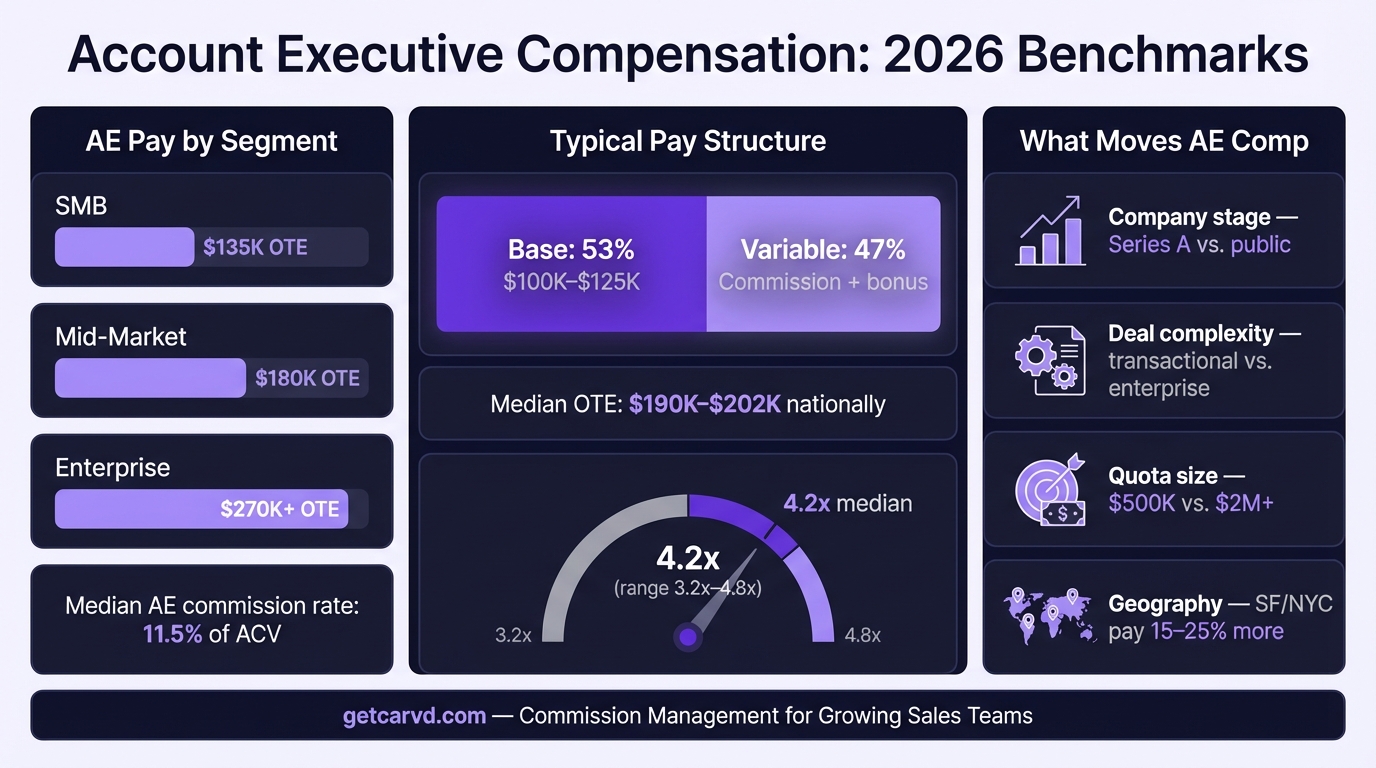
RepVue (verified submissions, March 2026): Median base salary: $100,000. Median OTE: approximately $190,000–$202,000 for US SaaS account executives. RepVue's data is crowdsourced from verified sales professionals and is among the most current and SaaS-specific benchmarks available.
Bridge Group — 2024 SaaS AE Metrics & Compensation Benchmark Report (287 B2B SaaS companies): Median OTE: $190,000 — up from $167,000 in 2022, representing roughly 5%+ compounded annual growth over the past decade. The Bridge Group study is the most widely cited empirical benchmark for SaaS AE compensation.
Glassdoor (2025–2026 submissions): Median base across all industries: $125,321, with the 25th–75th percentile range at $96,555–$166,049. For enterprise AEs specifically, Glassdoor puts median total compensation at $243,739.
Betts Recruiting (2025 Tech AE Compensation Trends): AEs with under 3 years of experience: $75,000–$110,000 base. AEs with 3–5 years: $90,000–$125,000 base. Betts notes that OTE typically runs at roughly 2x base — a $90K base implies ~$180K OTE at quota.
For the core Carvd audience — growth-stage SaaS companies with 5–50 reps — the relevant benchmark is a $95,000–$120,000 base with $175,000–$210,000 OTE for a full-cycle AE covering SMB or mid-market accounts.
OTE and base salary by AE segment
The biggest driver of AE compensation isn't geography or tenure — it's segment. Deal size, sales cycle length, and quota responsibility all scale with segment in ways that dwarf regional variations.
| Segment | Median base | Median OTE |
|---|---|---|
| SMB AE | $70,000 | $135,000 |
| Mid-Market AE | $90,000 | $180,000 |
| Enterprise AE | $138,000 | $270,000 |
Source: RepVue, March 2026 (verified submissions)
ICONIQ Growth's 2023 Sales Compensation data, based on their portfolio of growth-stage companies, puts the range wider: SMB AE OTE at roughly $150,000, with strategic/enterprise AE OTE approaching $350,000 for roles with $1M+ quota responsibility.
The spread matters when benchmarking. An SMB AE at a high-volume transactional company is compensated differently from an enterprise AE running 18-month, $500K+ deals — even if both carry the title "account executive."
OTE by company stage
Compensation also scales with company stage, though less dramatically than segment.
| Stage | Typical base range | Typical OTE range |
|---|---|---|
| Seed / Pre-Series A | $75K–$100K | $130K–$170K |
| Series A–B | $90K–$115K | $160K–$210K |
| Series C–D | $100K–$130K | $190K–$250K |
| Late-stage / public | $120K–$160K | $225K–$300K+ |
Sources: Betts Recruiting 2025, Seattle Corporate Search 2025 SaaS Benchmarks, Wellfound 2025 startup hiring data
Early-stage companies typically run 10–20% below late-stage benchmarks and compensate with equity. Growth-stage companies close most of the gap on base, with variable comp increasingly tied to structured quotas rather than milestone-based ARR bonuses.
Pay mix: what percentage of AE comp is variable
The 50/50 base-to-variable split is the most cited benchmark for AEs, and Bridge Group's 2024 empirical data supports it: 287 SaaS companies averaged a 53% base / 47% variable split.
That's meaningfully different from other sales roles:
| Role | Typical base:variable split |
|---|---|
| SDR / BDR | 65:35 to 70:30 |
| Account Executive | 50:50 to 53:47 |
| Account Manager | 60:40 to 65:35 |
| Sales Manager | 60:40 to 70:30 |
| VP of Sales | 70:30 to 80:20 |
AEs carry the highest variable exposure of any quota-carrying role. The rationale: an AE directly controls whether a deal closes. That direct control justifies — and requires — meaningful upside tied to performance.
For AEs evaluating offers, a pay mix more conservative than 55:45 usually signals either a very long sales cycle (where risk needs to be absorbed into base) or a quota that's set too aggressively for the variable to be realistic.
Commission rates: how AE commission is calculated
Two structures dominate for SaaS AEs:
Percentage of ACV (Annual Contract Value). The most common structure. The AE earns a fixed percentage of each deal's annual value. Bridge Group's 2024 benchmark puts the median rate at 11.5% of ACV at 100% quota attainment, with a typical range of 11–14%.
Example: A deal for $120,000 ACV at a 12% commission rate pays $14,400. Use the commission calculator to model payouts across different deal sizes and rate structures.
Tiered rates above quota. Above-quota accelerators are common in SaaS. ICONIQ Growth cites 10% as a standard new-logo rate, with an accelerator to 12–15% above 100% attainment. Reps hitting 120%+ often earn 1.5x–2x the base commission rate on incremental revenue.
Other components that affect total commission:
- Renewals and expansion: ICONIQ data shows most companies pay 4–5% on renewal revenue and 5–8% on expansion — deliberately lower than new logo rates to keep AE focus on net new.
- Multi-year deals: Many companies pay a premium (1.1x–1.25x) on multi-year contracts to incentivize longer commitments that improve NRR.
- Product mix: Per-product commission structures pay different rates on core vs. add-on products. See per-product commission structures explained for how these work.
For how to build these structures from scratch, how to build a sales compensation plan covers the mechanics in detail.
Quota-to-OTE ratios
The quota-to-OTE ratio tells you how much revenue each AE is expected to generate relative to what they cost. It's the primary lever for controlling sales cost as a percentage of revenue.
Bridge Group 2024: Median quota-to-OTE ratio of 4.2x, with a range of 3.2x–4.8x across surveyed companies. Median ACV quota: $800,000 (up from $740,000 in 2022).
ICONIQ Growth's recommended target: 5x–7x OTE. At 5x, an AE earning $190,000 in OTE would carry a $950,000 quota. Below 3x, the company is buying revenue at an unsustainable sales efficiency ratio. Above 7x, quota is set so aggressively that attainment rates collapse.
Which brings up the attainment problem. Bridge Group's 2024 data shows only 51% of AEs hit quota — down from 66% in 2022. When fewer than half of reps are reaching target, the OTE number in the job posting is aspirational, not realistic.
That gap between stated OTE and earned OTE is one of the most persistent credibility problems in sales compensation. It's also why tools like Carvd exist — reps who can see their real-time commission calculations through rep dashboards don't have to guess whether the OTE they were hired on is achievable.
Geographic variation
Geography affects base salary more than variable structure. Glassdoor's 2025–2026 data shows San Francisco AEs earning median total compensation with a base range of $131,940–$228,785 (25th–75th percentile) — roughly a 20–25% geographic premium over the national median.
Wellfound's startup hiring data (2025) puts average SF Bay Area AE base at $128,000, with a wide $65K–$330K range driven by stage variation.
The geography premium is compressing for remote-first companies. Betts notes remote AE comp is converging toward hub-city rates as tech companies decentralize — which means "remote-first" is less of a compensation discount than it was pre-2022.
For non-SF/NYC markets: Austin and Seattle command roughly a 15–20% premium over the national median. Phoenix and other secondary markets run roughly 5–10% below.
How to evaluate an AE compensation offer
The OTE number is the least useful data point in an offer. Here's what actually matters.
1. What percentage of the team hit quota last year?
If 40% of AEs hit target OTE, you're evaluating a 60th-percentile earner's comp, not a median earner's comp. Ask directly. If the answer is "we're not sharing that," the number is probably bad.
2. How is quota set?
Top-down quotas assigned without rep input tend to run aggressive. Market-calibrated quotas built from territory capacity and historical win rates are more achievable. Bridge Group's median attainment falling from 66% to 51% between 2022 and 2024 reflects the widening gap between quota-setting ambition and market reality.
3. What's the accelerator structure?
A plan that pays 10% on the first $800,000 and 15% on everything above is very different from one that caps at quota. Uncapped commission with meaningful accelerators is one of the actual signals of an AE-friendly comp plan. See uncapped commission: when it works and when it doesn't.
4. What's included in ACV?
Commission on new logo only? Expansion? Renewals? Professional services? The definition of "commissionable revenue" changes the effective rate significantly. ICONIQ's data showing 10% on new logo vs. 4–5% on renewals reflects a deliberate design choice — but you need to know which bucket your deals fall into.
5. Is there a clawback?
Most SaaS companies have commission clawback provisions for deals that churn or cancel within 90–180 days. Understand the trigger and the mechanics before accepting. For full details on how clawbacks work, see commission clawback: what it means and how to structure it.
How to design an AE comp plan
For sales leaders building or revising AE comp plans, the structure follows a predictable sequence.
Set OTE from market data, not reverse-engineering from budget. Use Bridge Group, RepVue, and Betts as anchors. If your OTE is more than 15% below market for your segment and stage, expect comp to be a rejection reason in final-round interviews.
Set quota at 4x–5x OTE for early-stage, 5x–6x for growth stage. Bridge Group's median of 4.2x is conservative relative to ICONIQ's recommended 5x–7x. The right number depends on your sales cycle length, average deal size, and whether your market has clear comparable benchmarks.
Use a 50:50 pay mix as the default. Adjust toward 55:45 base-heavy for longer sales cycles (6+ months) where rep income stability matters. Don't go below 40% variable — you lose the incentive alignment that makes commission work. Check your rates against market data using the commission rate benchmarks tool before finalizing the plan.
Design accelerators that change behavior. A 1.5x accelerator above 100% quota encourages reps to push past target rather than sandbagging. A 2x accelerator above 120% rewards your highest performers disproportionately — which is usually what you want. For how accelerators interact with tiered structures, see tiered commission structure: how it works.
Build in rep transparency. The single highest-leverage change most companies can make to commission plan effectiveness is giving reps real-time visibility into their calculated commission. Bridge Group's data on declining quota attainment correlates with declining rep trust — reps who can't verify their own number spend time shadow accounting instead of selling. On-target earnings: the complete guide covers how to set and communicate OTE in ways that maintain trust.
For other role benchmarks in the same system: sales manager compensation, SDR salary benchmarks, and tech sales salary data by role.
Salary data sourced from RepVue March 2026 verified submissions, Bridge Group 2024 SaaS AE Metrics & Compensation Benchmark Report (287 companies), Glassdoor 2025–2026 salary submissions, Betts Recruiting 2025 Tech AE Compensation Trends, ICONIQ Growth 2023 Sales Compensation Guide, Wellfound 2025 startup hiring data, and Seattle Corporate Search 2025 SaaS Salary Benchmarks. All figures reflect US market conditions. Adjust for industry, geography, and company stage.
Last updated: March 23, 2026