Sales Manager Salary & Commission: 2026 Compensation Benchmarks
Sales manager OTE ranges from $160K–$280K at SaaS companies. Benchmarks for base, variable pay mix, override commission, and how to structure manager comp plans.
Sales manager compensation sits in an awkward middle ground. These roles carry less direct selling risk than AEs — their variable pay is tied to team performance, not personal quota — but they also carry the operational weight of rep development, pipeline management, and forecast accuracy.
The result is a pay structure that looks different from any other sales role: more base-heavy, less commission-driven in the traditional sense, and often tied to a mix of team metrics, override rates, and management-specific objectives.
Here's what the market actually looks like.
What sales managers earn: salary benchmarks by context
Before using any salary number, it matters which industry and company type you're benchmarking against.
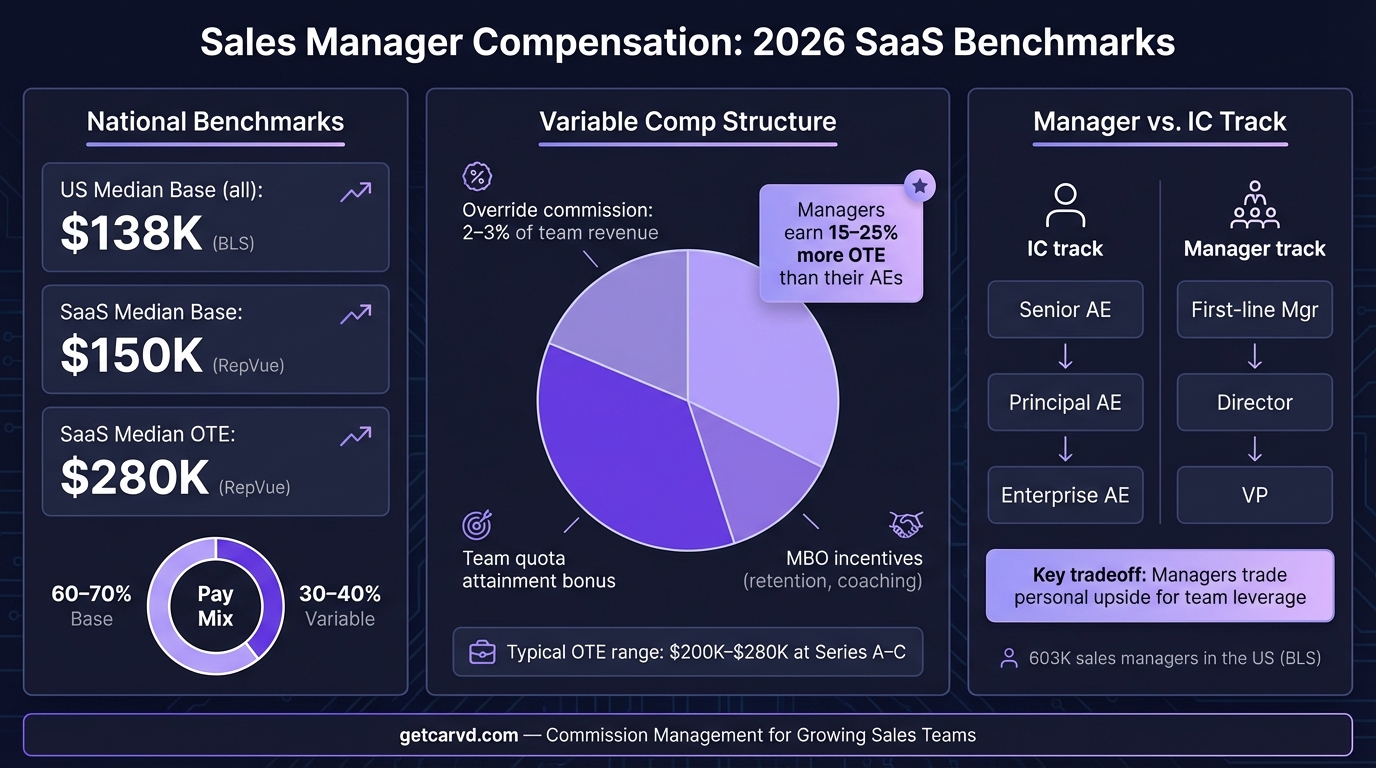
BLS May 2024 (all industries, all company sizes): The Bureau of Labor Statistics puts the median sales manager salary at $138,060. The mean is $160,930, reflecting the long tail of high earners at large companies. This figure covers 603,000 sales managers across retail, pharma, manufacturing, financial services, and tech — which dilutes the SaaS/tech benchmark significantly.
Glassdoor (March 2026, 71,000+ submissions): Average base salary across industries: $118,827. For the information technology sector specifically, the median total pay is $213,850 — a more useful benchmark for software and SaaS companies.
RepVue (SaaS-specific, February 2026): Median base: $150,000. Median OTE: $280,000. RepVue's data is crowdsourced from verified sales professionals, making it the most SaaS-specific benchmark available.
Betts Recruiting 2026 Compensation Guide (recruiter placement data): First-time sales managers: $120K–$160K base. Experienced managers: $140K–$200K base. Betts notes that 2024 was a period of stagnation for sales manager comp in tech following the 2021–2022 hiring peak.
For Carvd's ICP — startup founders and VPs of Sales at companies with 5–50 reps — the most relevant benchmark is the Series A–C SaaS range: $120K–$160K base, $200K–$280K OTE.
OTE by company stage
Sales manager compensation scales with company stage more than almost any other role. As the company grows, the team being managed gets larger and the dollar value of quota responsibility increases — which justifies higher variable payouts.
| Stage | Base range | OTE range | Notes |
|---|---|---|---|
| Seed / Pre-Series A | $100K–$140K | $130K–$180K | Often equity-heavy; variable tied to ARR milestones |
| Series A–B | $120K–$160K | $160K–$220K | Team quota structures forming |
| Series C–D | $140K–$200K | $200K–$280K | Override and bonus structures common |
| Late-stage / Public | $170K–$240K | $250K–$350K+ | Multi-team managers; significant equity component |
Sources: Wellfound SaaS hiring data (2025); Seattle Corporate Search 2025 SaaS Salary Benchmarks; Sybill Sales Salary Guide 2025.
Wellfound data shows an 18% salary premium from seed to Series C+ for sales roles — the highest stage premium of any GTM function.
Pay mix: why managers run more base-heavy
The standard AE pay mix in SaaS is 50:50 base-to-variable — Bridge Group's 2024 benchmark of 172 B2B SaaS companies puts it at 53:47. Sales managers run more conservative ratios.
| Role | Typical pay mix (base:variable) |
|---|---|
| AE (SaaS, SMB/Mid-Market) | 50:50 to 53:47 |
| First-line Sales Manager | 60:40 to 70:30 |
| Sales Director | 65:35 to 75:25 |
| VP of Sales | 70:30 to 80:20 |
The rationale: managers are measured on team outcomes they can influence but not control. A rep can make more calls, send more emails, and run more demos. A manager is limited by the reps they have. The higher base compensates for that reduced control over variable outcome.
The Alexander Group's sales compensation research confirms that variable exposure decreases as you move up the leadership hierarchy — more base, less commission risk.
How variable comp is structured for sales managers
Three mechanisms are used, often in combination.
Override commission
The override is the most common structure in SMB and mid-market SaaS. The manager earns a flat percentage of all revenue closed by their team — typically 2–3% on team-closed deals, compared to the rep's 8–12% direct commission rate.
Example: If a rep closes at 10% and the manager holds a 2% override, a $100,000 deal pays the rep $10,000 and the manager $2,000. A team of 6 reps hitting $5M combined generates $100,000 in override income at a 2% rate.
The override is simple to track and keeps manager incentives aligned with rep activity. The downside: high performers on the team have disproportionate impact on manager pay, which can create tension when managing mixed-performer teams.
Team quota attainment bonus
More common at growth-stage and enterprise SaaS companies, this structure pays the manager a fixed bonus when their team hits a defined quota threshold. Accelerators kick in above quota — often 1.2x–2x payout at 110–130%+ team attainment.
Example structure: $25,000 bonus at 100% team quota attainment, scaling to $50,000 at 125%+. Variable is tied to aggregate team performance, not individual deal flow.
This model provides more predictable variable income for managers but requires a reliable quota-setting process. Misaligned team quotas — too aggressive or too easy — break the incentive entirely. The commission plan builder lets you model team attainment thresholds and see projected manager payouts at 80%, 100%, and 120% before committing. For more on quota mechanics, see how to build a sales compensation plan.
MBO (management by objectives)
Sales managers are the role most likely to have MBO components in their comp plan. According to Everstage, 28% of sales manager comp plans include MBOs. SHRM guidelines recommend MBO bonuses represent at least 10% of total compensation to drive meaningful behavior.
Common manager-specific MBO objectives:
- Team quota attainment (often combined with override or bonus)
- Forecast accuracy (within 10% of final number)
- Rep retention (% of team hitting quota, or keeping headcount)
- Pipeline coverage ratio (3–4x quota)
- Onboarding completion (new rep time-to-quota)
MBOs work well for goals that don't map cleanly to revenue. Forecast accuracy is a good example — it matters operationally but doesn't directly generate commission. Tying 15–20% of variable to forecast accuracy aligns manager behavior with finance and ops priorities.
How to design a sales manager comp plan
Most comp plans for managers start from the AE baseline and adjust upward. Bridge Group's 2024 AE OTE is $190,000. First-line managers at those same companies typically earn 15–25% more — implying a $220K–$240K OTE floor for a SaaS team of 6–8 reps.
Step 1: Set OTE based on team size and stage
Use the stage benchmarks above as the starting point. A first-line manager running 4–6 AEs at a Series B company should be in the $200K–$240K OTE range. Model manager OTE scenarios in a Stackrows compensation template.
Step 2: Set pay mix
60:40 is the most common starting point. If your manager candidates are consistently asking for more base, your OTE is below market — not your mix.
Step 3: Choose the variable mechanism
For teams under 10 reps: override commission is simpler to administer and keeps alignment tight. For teams of 10+: team quota bonus scales better and avoids the complexity of tracking per-rep override across a large team.
Step 4: Add MBO for non-revenue objectives
If forecast accuracy, rep retention, or onboarding time matter to your ops team, attach 10–20% of variable to a specific MBO. One objective per quarter, measurable, and agreed in advance.
Step 5: Determine ramp
New managers typically get a 90–180 day ramp during which they receive partial or full variable pay regardless of team attainment. This matters during team-building phases when a manager inherits a team mid-cycle or builds from scratch.
Carvd's comp plan builder lets you model these structures — override rates, team quota attainment thresholds, and MBO payouts — and the commission calculator shows managers exactly how their own numbers were calculated alongside their reps'.
Regional variation
Geography affects base salary more than variable structure. Built In's 2026 data from verified submissions:
| City | Average base | Average total comp |
|---|---|---|
| San Francisco, CA | $122,340 | $213,769 |
| New York City, NY | $122,197 | $198,491 |
| Seattle, WA | $104,360 | $159,996 |
| Austin / Atlanta | $90K–$110K | $130K–$165K |
San Francisco and NYC command roughly a 20–35% geographic premium over the national average. Remote-first companies increasingly use geographic pay policies — either hub-city pay (paying SF rates regardless of location) or national median pay with a defined range.
How to evaluate a sales manager offer
If you're a sales manager assessing an offer, the variable structure matters as much as the base number.
Questions to ask:
- Is variable tied to team quota or individual override? (Team quota is more stable; override compounds with top performers)
- What is current team attainment? (If the team hit 72% last year, your variable projection is meaningless at 100% target)
- What's the quota-setting process? (Top-down without rep input → expect underattainment)
- Is there a ramp period for the team if you're inheriting it?
- What percentage of managers hit their variable target last year?
The last question is the most revealing. If 40% of managers earned target variable last year, the OTE is aspirational. If 70–80% hit it, the plan is calibrated.
For a fuller picture of how OTE is structured and evaluated across roles, see on-target earnings: the complete guide. For the mechanics of how commission rates tie into total comp planning, see variable compensation: types, structures, and best practices.
Salary data sourced from BLS OEWS May 2024, RepVue Sales Salary Guide 2026, Glassdoor March 2026, Betts Recruiting 2026 Compensation Guide, Bridge Group 2024 SaaS AE Metrics & Compensation, Pavilion 2025 GTM Compensation Benchmarks, and Built In 2026 salary submissions. Benchmarks reflect US market conditions and should be adjusted for industry, geography, and company stage.
Last updated: March 22, 2026