Inside Sales Representative Salary & Commission Benchmarks (2026)
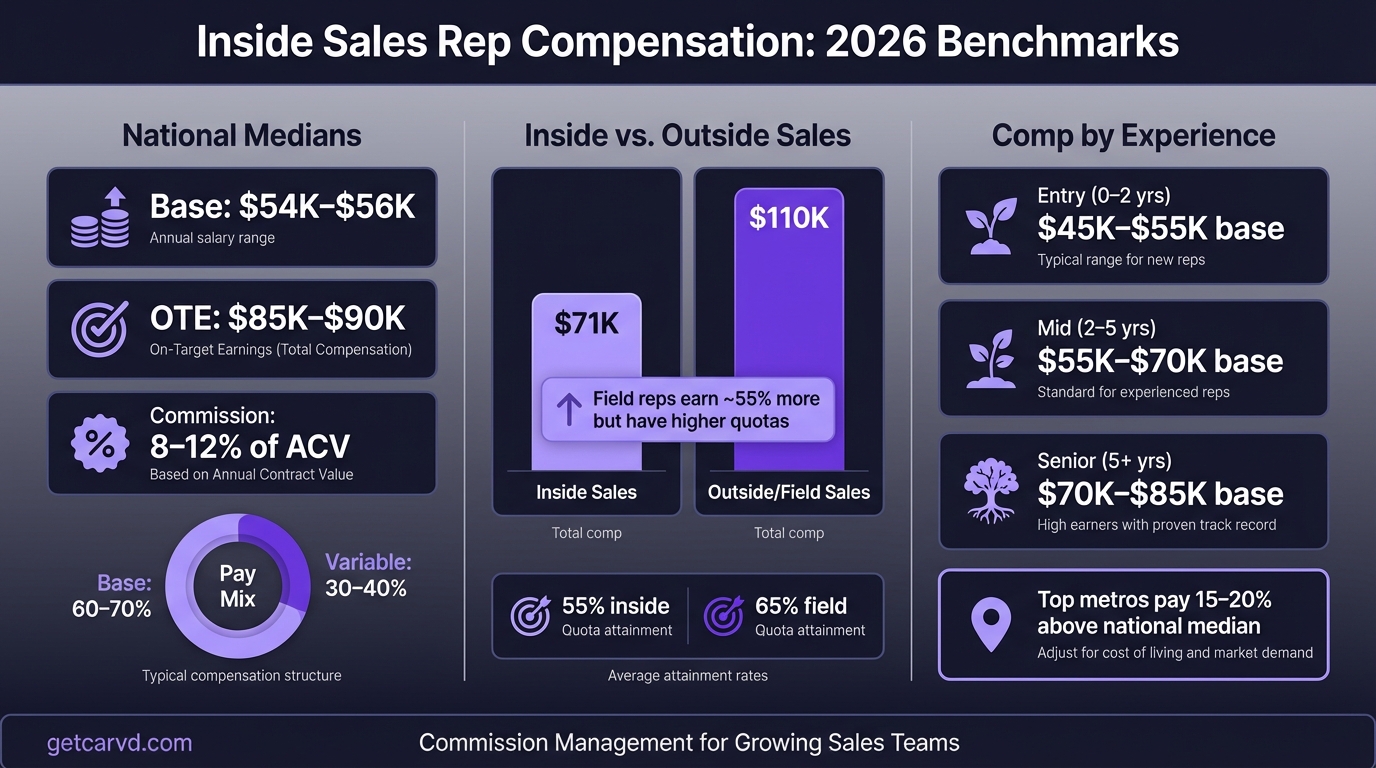
Inside sales reps earn a median base around $56K with OTE of $85K–$90K nationally. Full benchmarks by experience, industry, geography — plus how inside sales commission is structured.
The national average base salary for an inside sales representative is $54,206, according to Built In's 2026 data. Add variable comp and total earnings reach $70,000–$90,000 for a mid-level closing role. For SaaS roles with larger deal sizes — the "inside AE" tier — OTE often hits $110,000–$150,000.
The spread is wide because "inside sales" covers a spectrum: SDRs booking meetings, SMB closers working $10K deals, and inside enterprise AEs managing six-figure contracts from their desk. The role title tells you less than the deal size, segment, and plan structure underneath it.
Base salary, OTE, and pay mix
Inside sales compensation is more base-heavy than field sales. Closing reps typically see a 60–70% base / 30–40% variable pay mix. The variable percentage grows as deal size and complexity increase.
National benchmarks (2026):
| Role | Base salary | OTE | Pay mix |
|---|---|---|---|
| SDR / BDR (pipeline gen) | $55,000–$75,000 | $70,000–$95,000 | 65/35 |
| Inside sales rep (SMB closing) | $52,000–$65,000 | $80,000–$100,000 | 65/35 |
| Inside AE (mid-market) | $70,000–$90,000 | $120,000–$150,000 | 60/40 |
| Inside AE (enterprise, desk) | $90,000–$120,000 | $160,000–$210,000 | 55/45 |
| National median (all inside sales) | ~$56,000 | ~$85,000 | — |
Sources: Built In 2026 Inside Sales Salary data, Bridge Group 2024 AE Metrics & Compensation Benchmark, Seattle Corporate Search 2025 SaaS Sales Salary Benchmarks, Everstage Inside Sales Compensation Guide 2025.
The BLS May 2024 data for sales representatives (wholesale and manufacturing, excluding retail) puts the overall median at $63,230, with the top 25% reaching $93,280+. That skews higher than pure inside sales because it includes field reps.
How inside sales commission is structured
For closing roles, commission is typically a percentage of ACV (annual contract value) on closed-won deals:
- SMB inside sales (deals under $25K ACV): 10–15% commission rate
- Mid-market inside AE ($25K–$100K ACV): 8–12% commission rate
- Enterprise inside AE ($100K+ ACV): 5–8% commission rate
- SaaS median at 100% quota attainment: 11.5% of ACV, per Bridge Group's 2024 research across 170+ B2B SaaS companies
For prospecting roles (SDRs and BDRs), commission doesn't attach to closed revenue. Instead, variable pay is activity-based:
- $20–$50 per meeting booked
- $50–$100 per meeting held and qualified
- $100–$250 per sales-qualified lead (SQL)
- 0.5–4% of closed-won revenue from sourced deals (less common but aligns incentives with deal quality)
Accelerators are nearly universal. Everstage's 2025 compensation data shows 82% of SaaS companies use accelerators above quota. A typical structure:
- 1x multiplier at 0–100% quota
- 1.5x at 100–125%
- 2x at 125–150%
- 2–5x above 150%
Fewer than 15% of plans cap commission. Uncapped plans meaningfully change rep behavior — top performers care about whether blowout months pay out proportionally. To see how different rate structures affect take-home pay, run scenarios through the commission calculator.
Salary by experience level
Built In's 2026 self-reported pay data for inside sales representatives:
| Experience | Average base salary |
|---|---|
| Less than 1 year | $47,251 |
| 1–3 years | $56,004 |
| 3–5 years | $64,182 |
| 5–7 years | $63,219 |
| 7+ years | $55,775 |
The dip after 7 years reflects role divergence: top earners at that stage have usually moved into management, senior AE, or enterprise roles — which shows up under different titles and inflates the numbers elsewhere.
For SaaS-specific benchmarks (Betts Recruiting 2025–2026):
| Experience | Base range | Typical OTE |
|---|---|---|
| Under 3 years | $60,000–$80,000 | $100,000–$130,000 |
| 3–5 years | $75,000–$100,000 | $140,000–$160,000 |
| 5+ years (mid-market AE) | $90,000–$125,000 | $160,000–$200,000+ |
Experience buys base; quota performance buys OTE. A 3-year rep consistently hitting 120% attainment will outlearn a 7-year rep missing quota. Check where your commission rate sits relative to market using the commission rate benchmarks tool.
Geographic premiums
Location adds or subtracts 15–37% from national benchmarks. Built In's 2026 data for inside sales:
| Market | Average base | vs. national |
|---|---|---|
| San Francisco, CA | $81,174 | +37% |
| Dallas-Fort Worth, TX | $74,748 | +31% |
| Los Angeles, CA | $62,544 | +18% |
| Austin, TX | $62,415 | +18% |
| New York City, NY | $58,398 | +12% |
| Boston, MA | $58,134 | +12% |
| Remote (national median pay) | $58,982 | +13% |
| National average | ~$54,206 | — |
Dallas outperforming coastal markets reflects the migration of SaaS company HQs over the past several years. The remote premium shows that most remote roles benchmark to national median — not the company's headquarters city.
Companies using geo-banded pay (Pave / ICONIQ model) typically apply:
- Tier 1 (SF, NYC, Seattle): 100% of benchmark
- Tier 2 (Austin, Boston, Denver): 90–95%
- Tier 3 (Nashville, Charlotte, Miami): 80–85%
Industry benchmarks
Inside sales roles pay very differently depending on industry. BLS May 2024 data and Everstage/Glassdoor 2025 total comp benchmarks:
| Industry | Median total compensation |
|---|---|
| Pharmaceutical / biotech | $112,023 |
| Securities and investments | $102,000 |
| Software publishers (SaaS) | $98,370–$102,577 |
| Financial services | $100,246 |
| Insurance | $92,250 |
| Management consulting | $65,720 |
| Wholesale trade | $64,990 |
Pharma and financial services pay high because deal complexity is high, regulatory knowledge is required, and commission rates on large contracts add up quickly. SaaS is the sweet spot for inside sales overall — competitive pay, clear plan structures, and strong accelerator culture.
Quota expectations and attainment
Quota-to-OTE ratio: 4:1 to 5:1 is the standard benchmark. A rep with $85K OTE should carry $340K–$425K in annual quota. Below 4:1 means the company is overpaying for revenue; above 6:1 means most reps will miss.
For SaaS AEs specifically, Bridge Group's 2024 report puts the median annual quota at $800,000 ACV — up from $740K in 2022. Quotas have grown at roughly 2% per year; OTE has grown at roughly 5% per year. The gap between the two is why attainment rates are declining.
Attainment reality:
- Inside sales reps: approximately 55% hit quota (vs. ~65% for outside/field reps)
- B2B SaaS AEs broadly: 50–51% hit quota, down from 66% in 2022 (RepVue)
- All B2B sales roles, Q4 2024: 43.1% average attainment (RepVue Cloud Sales Index)
- A "healthy" team benchmark: 60–70% of reps hitting quota
If your comp plan assumes 85%+ of reps hit quota, your OTE projections are wrong. Building a plan around realistic attainment distributions matters more than optimizing the commission rate on paper.
Inside sales vs. outside/field sales: the pay gap
Inside reps earn less than their field counterparts, and the gap is consistent across industries:
| Factor | Inside sales | Outside / field sales |
|---|---|---|
| Average base salary | $52,000–$60,000 | $75,000–$87,000 |
| Average annual commission | ~$12,000 | ~$22,560 |
| Total annual comp | ~$71,000–$75,000 | ~$87,000–$110,000 |
| Pay mix | 60–70% base, 30–40% variable | 50–60% base, 40–50% variable |
| Quota basis | Volume, MRR, ACV | Annual revenue contracts |
| Deal size | Smaller, faster cycles | Larger, longer cycles |
Indeed's 2025 data: inside reps average $59,411 base + $12,000 commission = ~$71,411 total. Outside reps average $87,380 base + $22,560 commission = ~$109,940 total — roughly a $38,500 gap.
The gap reflects deal complexity, not role difficulty. Outside reps manage multi-stakeholder, multi-quarter deals. Inside reps move faster at lower contract values. Neither is easier; the economic math just produces different commission pools.
What actually moves your number
Five factors explain most of the spread between a $70K-OTE inside sales offer and a $120K-OTE one:
1. Deal size. Commission rates don't fully offset the difference in deal sizes. A 12% rate on $20K ACV generates $2,400 per deal. A 10% rate on $80K ACV generates $8,000. The biggest lever on inside sales OTE is the ACV of the deals in the pipeline.
2. Segment. SMB inside reps close more deals at lower rates; mid-market reps close fewer at higher rates. Mid-market pays more, but the pipeline is harder to build and cycles are longer.
3. Industry. Pharma, software, and financial services pay above-median for inside roles. Retail, wholesale, and generic B2B pay closer to national averages.
4. Inbound vs. outbound. Inbound-heavy roles (strong marketing pipeline) carry higher quotas but lower OTE per dollar of quota. Outbound roles — where reps source their own pipeline — often pay a 5–10% base premium.
5. Quota achievability. OTE is a promise, not a guarantee. Before accepting a role, ask: what percentage of reps hit quota last quarter and last year? A team where only 30–40% hit quota means most reps earn significantly below OTE.
Evaluating an inside sales offer
The headline OTE matters less than the details underneath it:
- Quota-to-OTE ratio. Is it between 4:1 and 6:1? Outside that range, either the company is losing money on commissions or the OTE is unreachable.
- Payout threshold. At what attainment percentage does variable pay start? 70–80% is standard. Anything higher punishes moderate-miss months severely.
- Accelerator structure. Does the plan pay disproportionately above quota? A 2x multiplier at 120% meaningfully changes the ceiling.
- Draw period. Many inside roles offer a ramp draw for 60–90 days. Get the details — is it recoverable or non-recoverable?
- Attainment data. Ask for last quarter's and last year's attainment distribution. A team where 70% of reps hit quota is fundamentally different from one where 35% do.
For reps tracking their earnings mid-cycle, or sales leaders building inside sales comp plans, Carvd automates the commission calculation and shows every rep exactly how their payout was derived — by deal, by period, and by plan tier. When the cycle closes, the payroll export generates a payroll-ready CSV in one click.
For how inside sales compensation fits the broader sales role landscape, see SDR salary benchmarks, sales manager compensation, and variable compensation structures.
Salary data sourced from Built In 2026 Inside Sales Representative Salary data, Bridge Group 2024 AE Metrics & Compensation Benchmark Report, Betts Recruiting 2025–2026 Compensation Guide, Seattle Corporate Search 2025 SaaS Sales Salary Benchmarks, Everstage Inside Sales Compensation Guide 2025, RepVue Cloud Sales Index Q4 2024, BLS Occupational Employment and Wage Statistics May 2024, and Indeed Salary data (August 2025). Benchmarks reflect US market conditions and should be adjusted for geography, industry, and company stage.
Last updated: March 23, 2026