Tech Sales Salary: What SDRs, AEs & Leaders Earn in 2026
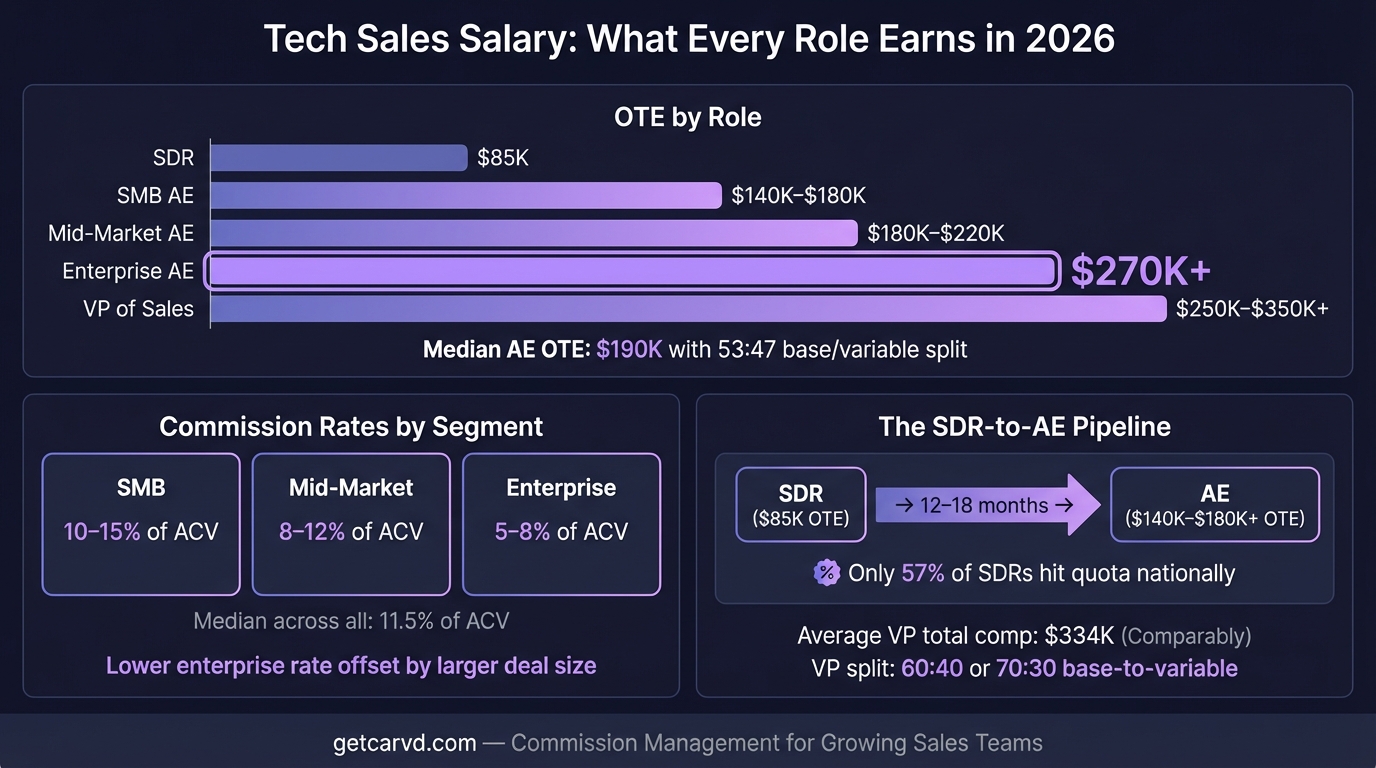
Tech sales salaries range from $85K OTE for SDRs to $270K+ for enterprise AEs. Current benchmarks by role, company stage, and pay mix — sourced from RepVue, Bridge Group, and Betts.
Tech sales careers span one of the widest compensation ranges in any profession. An SDR in their first year might earn $70K OTE. An enterprise AE at a Series D company might earn $350K. And a VP of Sales at a late-stage startup can earn more than most engineering directors, especially with equity.
The numbers below are drawn from verified compensation data — not job board averages, which skew toward posted roles rather than actual pay. Here's what the market looks like by role in 2026.
SDR: the entry point into tech sales
Sales development reps (SDRs) are the prospecting engine of B2B sales teams. Their job is pipeline generation — identifying prospects, sending outbound sequences, and booking qualified meetings for account executives.
2026 benchmarks (RepVue, March 2026; Betts Recruiting 2025):
| Metric | Figure |
|---|---|
| Median base salary | $60,000 |
| Median OTE | $85,000 |
| Typical base range | $55,000–$75,000 |
| Typical OTE range | $70,000–$95,000 |
| Pay mix | 65–70% base / 30–35% variable |
| Top earner ceiling | $129,235+ |
SDR variable comp is structured differently from AE commissions. Most SDRs earn a per-meeting or per-qualified-opportunity bonus — typically $20–$100 per accepted meeting — rather than a percentage of closed revenue. Some teams use a 2–5% pipeline credit on deals their outbound efforts sourced.
One number that matters for SDR comp plan design: RepVue's data shows only 57% of SDRs nationally reach or exceed quota. If your SDR comp plan assumes 90% attainment, your projections are wrong. Plan around the actual attainment distribution.
Geographic variation is real. Seattle SDRs see a median OTE near $100K; San Francisco and San Diego SDRs average around $90K. Remote roles at companies using national median pay typically land closer to $75K–$80K OTE.
Account executive: the core of tech sales compensation
AEs carry quota. Their compensation structure reflects that — variable pay is a larger share of total comp than any other sales role below VP level.
SMB AE benchmarks (Seattle Corporate Search 2025; Betts Recruiting 2025):
| Metric | Figure |
|---|---|
| Base salary range | $75,000–$100,000 |
| OTE range | $140,000–$180,000 |
| Commission rate | 10–15% of ACV |
| Pay mix | ~50:50 base:variable |
Mid-market AE benchmarks:
| Metric | Figure |
|---|---|
| Base salary range | $75,000–$110,000 |
| OTE range | $140,000–$180,000 |
| Commission rate | 8–12% of ACV |
| Pay mix | 50:50 to 53:47 |
Enterprise AE benchmarks (RepVue March 2026; Bridge Group 2024):
| Metric | Figure |
|---|---|
| Median base | $138,000 |
| Median OTE | $270,000 |
| Enterprise AE OTE range | $180,000–$250,000+ |
| Commission rate | 5–8% of ACV |
| Senior AE (7+ years, Fortune 500 accounts) | $130K base / $300K+ total comp |
The drop in commission rate from SMB (10–15%) to enterprise (5–8%) is offset by deal size. An enterprise AE closing $2M+ annually at 6% earns more than an SMB AE closing $400K at 12%. The quota-to-OTE ratio holds across segments — Bridge Group's 2024 benchmark puts the median at 4.2x, meaning an AE at $190K OTE is expected to close ~$800K ARR.
The most cited AE benchmark: Bridge Group's 2024 SaaS AE Metrics & Compensation report, based on 172 B2B SaaS companies, puts median AE OTE at $190,000 with a 53:47 base-to-variable split and a median commission rate of 11.5% of ACV at 100% quota attainment.
Sales manager: variable comp shifts from personal to team
Sales managers move from personal quota to team accountability. Their comp structure reflects that shift: more base-heavy, with variable tied to override commissions or team attainment bonuses rather than personal deal flow.
2026 benchmarks (RepVue, Betts Recruiting, Bridge Group):
| Stage | Base range | OTE range |
|---|---|---|
| Seed / Pre-Series A | $100K–$140K | $130K–$180K |
| Series A–B | $120K–$160K | $160K–$220K |
| Series C–D | $140K–$200K | $200K–$280K |
| Late-stage / Public | $170K–$240K | $250K–$350K+ |
Typical pay mix for first-line managers: 60:40 to 70:30 base-to-variable. Variable is usually a 1–3% override on team revenue, a team quota attainment bonus, or a mix of both. For more on how manager comp plans are designed, see sales manager salary & commission benchmarks.
Sales director and VP of Sales
Leadership compensation widens as scope expands. Directors manage managers; VPs own the entire revenue function. Their comp is less commission-driven and more milestone- and equity-weighted, especially at earlier stages.
Sales director (Seattle Corporate Search 2025):
| Metric | Figure |
|---|---|
| Base salary range | $130,000–$180,000 |
| OTE range | $180,000–$260,000 |
| Pay mix | 65:35 to 75:25 base:variable |
VP of Sales (Comparably March 2026; Seattle Corporate Search 2025; Everstage 2025):
| Stage | Base range | OTE range |
|---|---|---|
| Seed / Series A | $140,000–$180,000 | $180,000–$240,000 |
| Series B–C | $180,000–$220,000 | $250,000–$350,000 |
| Late-stage / Public | $220,000–$300,000+ | $350,000–$500,000+ |
Comparably's March 2026 data puts average VP of Sales total comp at $334,394, with the 25th–75th percentile range from $252K to $454K. Equity is material at this level — startup VPs at Series A–B typically receive 0.3–1% of equity, which can dwarf cash comp at exit.
How pay mix shifts across the ladder
The higher you go in a tech sales organization, the more base-heavy the comp becomes. Not because leadership earns less variable — they don't — but because the link between individual action and revenue outcome weakens as scope expands.
| Role | Typical pay mix (base:variable) |
|---|---|
| SDR | 65–70% base / 30–35% variable |
| Account Executive | 50–53% base / 47–50% variable |
| Sales Manager | 60–70% base / 30–40% variable |
| Sales Director | 65–75% base / 25–35% variable |
| VP of Sales | 70–80% base / 20–30% variable |
The Alexander Group's sales compensation research confirms this pattern: variable exposure decreases as seniority increases. An AE has maximum leverage over a deal. A VP of Sales is one step removed from every deal in the pipeline.
Commission rates by role and segment
Commission rates in tech sales are not uniform. They compress at both ends of the deal spectrum — SDRs earn per-activity bonuses, enterprise AEs earn lower percentages on larger ACVs — and are highest for SMB and mid-market AEs who own the full sales cycle.
| Role | Typical commission rate | Notes |
|---|---|---|
| SDR | $20–$100 per qualified meeting | Or 2–5% pipeline credit |
| SMB AE | 10–15% of ACV | Full-cycle ownership |
| Mid-Market AE | 8–12% of ACV | Longer cycles, larger deals |
| Enterprise AE | 5–8% of ACV | Higher ACV offsets lower rate |
| Sales Manager | 1–3% team override | On team-closed revenue |
Source: Bridge Group 2024; Prowi.io 2026 commission rates by role.
Bridge Group's 2024 data shows that AE commission rates have held relatively stable since 2021. OTEs have grown at roughly 5% CAGR over the past decade; quota growth has lagged at about 2% CAGR — meaning reps are earning more relative to what's expected of them. The commission rate benchmarks tool lets you compare your rate against current market data by role and industry.
What moves your number up or down
Tech sales compensation varies by more than role title. Five factors explain most of the spread between a $120K-OTE AE and a $280K-OTE AE at nominally similar companies:
1. Company stage. Wellfound data shows an 18% salary premium from seed to Series C+. Early-stage companies compensate with equity, not cash.
2. Segment. Enterprise roles pay more per deal because ACVs are larger, but the path to high OTE is longer — fewer deals close, and cycles run 6–18 months.
3. Geography. San Francisco and NYC carry a 20–35% base premium over national medians. Remote companies that use geographic pay banding have compressed this spread.
4. Industry within tech. Cloud infrastructure, cybersecurity, and fintech SaaS consistently pay above the median for equivalent roles. MarTech and HR tech tend to be below median.
5. Quota design. OTE is only meaningful if the quota is achievable. Historically, 57–65% of AEs nationally hit quota (RepVue). If you're evaluating an offer, ask what percentage of reps earned target variable last year. If the answer is below 50%, the OTE is aspirational.
Calculating your own commission
For reps trying to model their own take-home, the math on a standard AE plan works like this:
If you earn 10% commission on ACV with a $600K annual quota:
- At 100% attainment: $60,000 in commission
- At 80% attainment: $48,000
- At 120% attainment (with a 1.25x accelerator): $90,000
Teams with tiered accelerators can see significant upside above quota. Understanding exactly how your plan calculates — which deals count, when commission is earned, whether there are clawback periods — matters more than the headline OTE number.
The commission calculator lets you model this across plan types, and Carvd's rep dashboards show reps a deal-by-deal breakdown of how their commission was calculated, so "what did I actually earn and why" is never a mystery.
For the full picture on how OTE is set and structured across sales roles, see on-target earnings: the complete guide. For how commission rates fit into total comp design, see variable compensation: types, structures, and best practices.
Salary data sourced from RepVue Sales Salary Guide (March 2026), Bridge Group 2024 SaaS AE Metrics & Compensation Benchmark Report, Betts Recruiting 2025 Tech Sales Compensation Trends, Seattle Corporate Search 2025 SaaS Sales Salary Benchmarks, Everstage 2025 SaaS Sales Compensation Benchmarks, Comparably March 2026, and Prowi.io 2026 Commission Rates by Role. Benchmarks reflect US market conditions and should be adjusted for industry, geography, and company stage.
Last updated: March 22, 2026