Commission Tracking Spreadsheet: Free Template + When to Upgrade
Build a commission tracking spreadsheet that works. Covers the 8 essential columns, formulas for every plan type, and 4 signals it's time to replace it with software.
A commission tracking spreadsheet works until it doesn't. For a team of 5–8 reps on a flat-rate plan, a well-built spreadsheet is a reasonable solution. For a team with three plan types, mid-year amendments, and 20 reps asking why their number looks wrong, it isn't.
This guide covers both: how to build a commission spreadsheet that actually works, and how to recognize when you've hit its limits.
What a commission tracking spreadsheet needs to do
Before building anything, get clear on what the spreadsheet has to handle:
- Capture all revenue data — every closed deal with the right rep, amount, product, and close date
- Apply the correct plan — flat rate, tiered, per-product, draw, or some combination
- Calculate per-rep commission — accurately, with the right formula for each plan type
- Track payment status — what's been approved and what's been paid
- Give reps a way to verify — this is the one most spreadsheets skip, and it's why disputes happen
If your spreadsheet does 1–4 but not 5, reps will build their own. According to WorldatWork's research, over 80% of companies pay salespeople inaccurate commissions — and a significant part of that problem comes from processes where reps can't verify the math themselves.
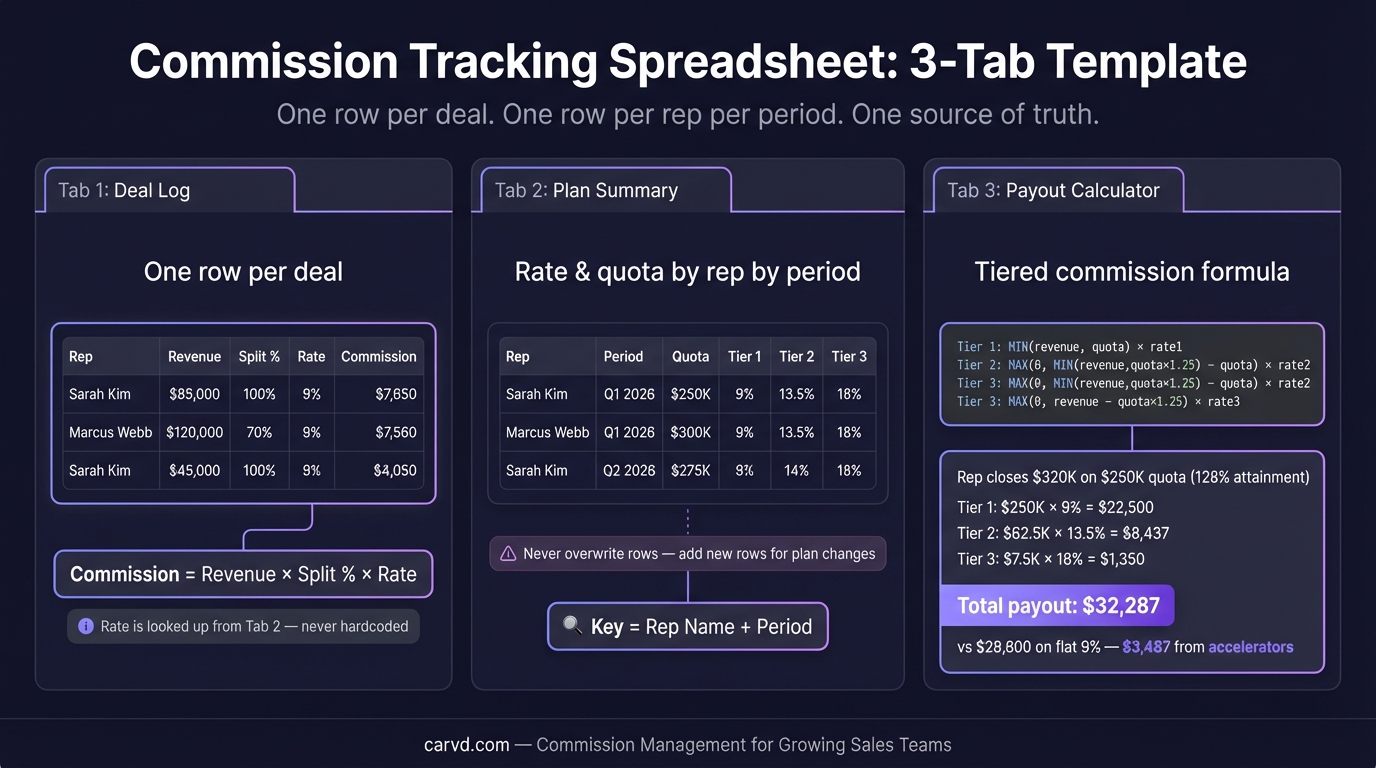
The 8 essential columns
Start with one row per deal, not one row per rep. Deal-level tracking gives you the audit trail you need when a rep disputes a payout.
| Column | What goes here |
|---|---|
| Rep name | Standardize on one format — "Last, First" or email — to avoid matching errors |
| Deal / transaction ID | CRM deal ID if you have one; otherwise a generated unique ID |
| Close date | The date the deal closed, not the invoice date or payment date |
| Revenue amount | The commissionable amount — check whether your plan uses ACV, TCV, or collected revenue |
| Product / category | Required for per-product plans; useful for all plans for auditing |
| Commission rate | The rate applied to this deal — enter manually or pull from a rate table |
| Commission amount | Formula field: =revenue * rate for flat plans; formula varies for tiered |
| Payment period | Which pay cycle this deal falls into (e.g., "2026-Q1") |
| Payment status | Draft / Approved / Paid — update manually after each run |
One optional column worth adding: plan version. If you've updated comp plans mid-year, you need to track which plan version applies to each deal. This is where most commission spreadsheets fail when things go wrong — without a version column, you can't audit a historical dispute six months later.
Formulas for every plan type
Flat rate
=C2*D2
Where C2 is revenue and D2 is the commission rate. If all reps are on the same rate, you can hardcode it:
=C2*0.10
If different reps have different rates, put the rates in a lookup table on a separate tab and use VLOOKUP or XLOOKUP to pull the right rate by rep name.
Tiered commission
Tiered plans need a formula that applies different rates to different revenue brackets — not the top rate to all revenue.
Example tiers:
- 0–$50,000: 8%
- $50,001–$100,000: 12%
- Above $100,000: 15%
Formula for a single rep's monthly total in cell B2:
=IFS(
  B2<=50000, B2*0.08,
  B2<=100000, 50000*0.08 + (B2-50000)*0.12,
  TRUE, 50000*0.08 + 50000*0.12 + (B2-100000)*0.15
)
The most common tiered commission spreadsheet error is applying the top tier rate to all revenue. A rep closing $130,000 does not earn 15% on the full amount — only on the $30,000 above the $100,000 threshold. For the full tiered commission formula breakdown, see commission formula.
Accelerator
For plans that pay a higher rate above quota, add a quota column and split the calculation:
=IF(
  B2<=quota,
  B2*base_rate,
  quota*base_rate + (B2-quota)*(base_rate*accelerator_multiplier)
)
Where quota, base_rate, and accelerator_multiplier reference named cells or a separate parameters tab. Hardcoding these values into formulas creates maintenance problems every time the plan changes.
Per-product
If different products carry different rates, you need a rate lookup table: one row per product, one column for the rate.
=C2*VLOOKUP(E2, RateTable, 2, FALSE)
Where E2 is the product name and RateTable is a named range on your rates tab. Every product name in your deals data must match exactly what's in the rate table — case-sensitive mismatches silently return errors.
A worked example
Here's a complete example for a rep with a tiered plan and an accelerator:
Plan:
- Tiers: 8% on first $75K, 12% above $75K
- Quota: $100,000/month
- Accelerator: 1.25x on all commission when quota is exceeded
Results for March:
| Deal | Revenue | Product | Commission rate | Commission |
|---|---|---|---|---|
| ACM-001 | $45,000 | Core platform | 8% | $3,600 |
| ACM-002 | $30,000 | Core platform | 8% (remaining in tier 1) | $2,400 |
| ACM-003 | $25,000 | Core platform | 12% (above $75K) | $3,000 |
| ACM-004 | $15,000 | Add-on | 12% | $1,800 |
| Total | $115,000 | $10,800 |
Rep hit 115% of quota ($115,000 / $100,000), so the 1.25x accelerator applies:
$10,800 × 1.25 = $13,500
Final payout: $13,500
Without the accelerator, this rep earns $10,800. The accelerator adds $2,700 for $15,000 above quota — a 25% commission increase for 15% revenue overperformance. That's the intended incentive.
This is manageable to calculate in a spreadsheet for one rep. For 20 reps, some on different plan types, some with mid-period amendments — it becomes a full-day project every pay cycle. If you want to test your own numbers before building a full spreadsheet, the commission calculator handles flat, tiered, and per-product structures instantly.
The 4 signals you've outgrown your spreadsheet
1. Commission runs take more than 4 hours
According to WorldatWork's research, 47% of companies take four or more weeks to process incentive compensation payouts. That lag has a cost beyond admin time — reps waiting on numbers can't plan, and delayed payouts signal disorganization.
If your commission run consistently takes more than half a day, the spreadsheet isn't scaling with your team.
2. You have more than one comp plan type
A single flat-rate plan across all reps is manageable. The moment you have a mix — some reps on tiered, some on per-product, a new hire on a draw, a senior rep with different accelerators — each plan needs its own sheet or its own formula logic. Errors multiply across plan versions.
According to Xactly's 2024 Sales Compensation Report (conducted with Benchmarkit), 70% of companies still use spreadsheets to manage compensation plan design — but the same data shows that complexity, not size, is the primary driver of error.
3. Reps are questioning the math
When reps ask "can you show me the calculation?", a spreadsheet can't answer that question cleanly. You can share the file, but walking a rep through nested IF formulas to explain a $400 discrepancy takes longer than just cutting them a check and hoping it doesn't happen again.
The result is shadow accounting — reps tracking their own commissions in separate spreadsheets to double-check yours. A 2024 peer-reviewed study published in Frontiers of Computer Science found 94% of business spreadsheets contain errors. Reps know this, which is why they verify. The problem isn't distrust of the team — it's that the spreadsheet gives them no other way to check. Software with rep dashboards solves this by letting reps see deal-level breakdowns on their own.
4. You've had a dispute you couldn't resolve
If a rep came to you with a specific disputed deal and you couldn't immediately pull up the data showing which plan applied, which rate was used, and when the deal was counted — your spreadsheet doesn't have the audit trail you need.
Disputes that drag on past two weeks cost real money: in time, in rep goodwill, and sometimes in legal exposure if the company is in a state with commission protection laws.
What to do instead
If any of those signals apply, you have two options:
Option 1: Restructure the spreadsheet — add a rate lookup table, version tracking, and a summary tab that shows per-deal breakdowns reps can review. This works if your plan complexity is low and your team is under 15 reps. For a professional starting point, try Stackrows templates. The commission formula reference covers the formulas you need for each plan type.
Option 2: Switch to commission software — tools like Carvd import your CRM data directly via CSV deal import and show reps exactly how each payout was derived. You stop spending time building and maintaining spreadsheets and start spending it reviewing results. Setup takes under an hour for most teams.
The spreadsheet isn't wrong. It's just bounded. For teams where commission complexity has grown past what a spreadsheet can handle cleanly, software is the practical choice — not because spreadsheets are bad, but because the hours and error risk add up.
Related reading:
Last updated: March 22, 2026