Short-Term Incentive Plan (STIP): Design Guide for Sales Orgs
A short-term incentive plan pays variable compensation over cycles of one year or less. Here's how to design one that works for sales-adjacent roles.
Most sales reps earn commissions — a percentage of each deal, calculated transaction by transaction. But commissions don't work well for sales managers, directors, VPs of Sales, and revenue operations staff whose contributions don't map cleanly to individual closed deals. That's the gap a short-term incentive plan (STIP) fills.
A STIP is variable pay tied to achieving defined goals over a performance cycle of one year or less. According to WorldatWork's Incentive Pay Practices survey, roughly 90% of publicly traded companies use annual incentive plans for managers and executives. The structure is common even if the terminology varies — you'll see it called a STIP, AIP (annual incentive plan), bonus plan, or just "the incentive program."
This guide covers how STIPs work, where they fit alongside commission plans, and how to design one that pays out fairly without becoming a payout ceiling employees stop believing in.
What a short-term incentive plan is
A short-term incentive plan is a structured bonus program that pays employees based on achieving measurable goals within a defined performance period — typically one year, sometimes quarterly or semi-annual.
Three structural elements define every STIP:
- Target bonus: The payout as a percentage of base salary when goals are fully achieved. This varies by role.
- Performance metrics: The goals that determine payout — revenue, profit, quota attainment, customer retention, or a mix.
- Payout curve: The relationship between performance and payout — typically a threshold below which nothing is paid, a target at 100% performance, and a maximum cap above which additional performance earns nothing extra.
Unlike a commission plan, a STIP doesn't pay per transaction. The math settles once per cycle based on the aggregate result.
STIP vs. commission: where each one belongs
| Commission plan | Short-term incentive plan | |
|---|---|---|
| Who uses it | Sales reps (AEs, SDRs, CSMs) | Managers, directors, VPs, ops staff |
| What it pays on | Individual deals closed | Team, department, or company goals |
| When it pays | Per deal, monthly, or quarterly | End of performance period |
| Formula | % of deal value | Target bonus × performance factor |
| Predictability | Variable (deal-by-deal) | Semi-predictable (target %) |
| Capped? | Often uncapped or soft-capped | Almost always capped at 150–200% of target |
Many sales organizations layer both. A VP of Sales might earn an override on their team's deals (commission-like) plus an annual STIP tied to team revenue attainment. A sales manager might earn a smaller direct commission and a STIP based on their team hitting collective quota.
For pure individual contributors — AEs, SDRs, account managers — commissions are almost always the better design. STIPs reward aggregate results; commission plans reward individual hustle. Mixing them without clarity creates confusion about which behavior you're actually incentivizing. See our guide to sales incentive plan design for how these structures interact.
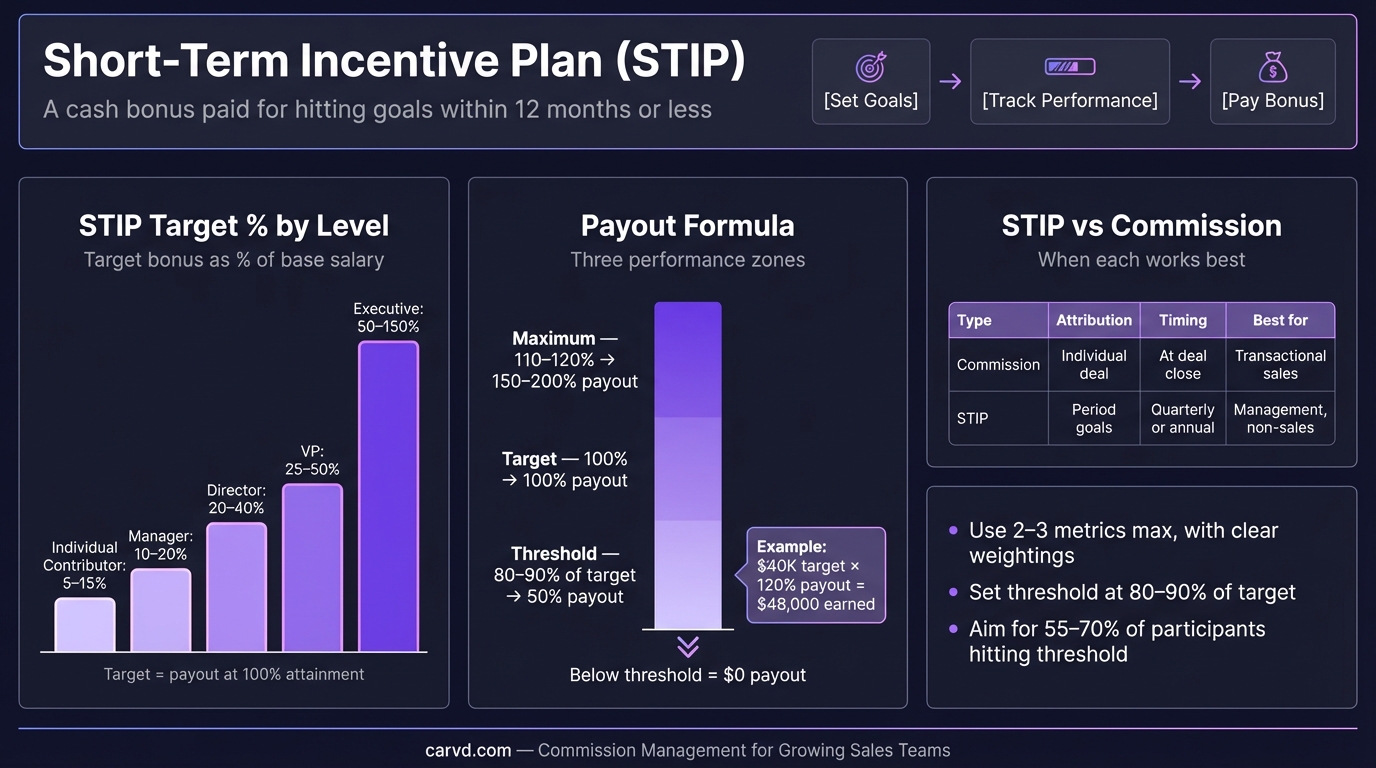
Target bonus percentages by role
One of the most common design questions: how large should the STIP target be?
CAP Partners' benchmarks for private companies provide the clearest reference:
| Role | Typical STIP target (% of base salary) |
|---|---|
| CEO | 80% |
| Other executives / officers | 40% |
| Managers and supervisors | 15% |
| Exempt salaried individual contributors | 10% |
| Non-exempt / hourly | 5% |
For sales-specific roles, the percentages shift because a meaningful share of variable pay is already in the commission plan. A VP of Sales at a 30-rep SaaS company might have a 20–30% STIP target on top of a commission or override plan, rather than 40%. The right number depends on how much variable pay is already built into the commission structure.
The general principle: total variable pay (commission + STIP) should represent a meaningful share of on-target earnings for the role to remain motivating — typically 25–50% for sales-adjacent roles. Use the OTE calculator to model how STIP targets interact with base salary and commission at different attainment levels. The variable compensation post has more on how to think about this split.
Designing the payout curve
Most STIPs use a three-point payout curve:
- Threshold: Minimum performance required to earn any payout — usually 80% of goal. Below threshold, the STIP pays zero.
- Target: 100% of the target bonus, paid at 100% goal achievement.
- Maximum: The cap — typically 150–200% of the target bonus, paid at 120–130% goal achievement.
Per CAP Partners' data on large public companies, roughly 70% cap maximum payouts at 200% of target. The remaining 30% use 150% or custom caps.
Why cap it? Without a cap, exceptional performance years create budget variance that finance can't plan around, and employees who hit maximum tend to anchor expectations to that number the following year. With a cap, you protect the comp budget while still rewarding strong performance.
Between threshold and target, payouts scale linearly (or on a straight-line basis). Some plans use stepped payout tables instead — for example, 75% payout at 90% of goal, 90% at 95%, 100% at 100%. Linear scaling is simpler to administer and easier for employees to understand.
One risk with three-point curves: the threshold can create cliff effects. If a rep hits 79.9% of goal, they receive nothing. If a manager hits 80.1%, they receive 50% of target. That cliff creates perverse incentives late in the performance period — either a push to get above threshold regardless of deal quality, or a decision to defer activity into the next period if threshold looks unachievable. Softer threshold transitions (a graduated payout from 70–80% rather than a hard cliff at 80%) reduce this.
Choosing the right metrics
Semler Brossy's 2024 Annual Incentive Plan Report (covering the top 250 U.S. public companies) found that 64% of companies use 2–3 financial measures in their incentive plans, with profitability metrics weighted at roughly 50%. For the sales organization specifically, the most common metric choices are:
Revenue metrics
- Revenue attainment against plan (most common)
- New ARR or new bookings
- Revenue from target customer segments
Efficiency metrics
- Gross margin or contribution margin
- Customer acquisition cost vs. target
Retention metrics
- Net revenue retention (NRR)
- Gross revenue retention (GRR)
- Customer churn rate
Team performance metrics
- Percentage of reps hitting quota
- Pipeline coverage ratio
- Average time-to-close
Semler Brossy's 2024 data also notes that 79% of large companies include non-financial measures in their plans — for sales orgs, this often means customer satisfaction (CSAT or NPS), or strategic project completion like CRM implementation or process improvement milestones.
The practical ceiling is 4–5 metrics per plan. More than that, and employees can't remember what they're working toward. Weight financial metrics most heavily (50–70%), add one or two operational or customer-focused metrics for the rest.
Performance periods: quarterly vs. annual
Annual STIPs are the standard because they allow time for revenue to develop, smooth out quarter-to-quarter volatility, and reduce gaming. They also align with budget cycles, making it easier to fund payouts.
Quarterly STIPs are common in sales environments where performance is highly measurable and feedback speed matters. Bridge Group's 2024 SaaS AE Metrics Report found quarterly commission cadences are standard for AEs — and some companies extend that rhythm to STIP-eligible roles like frontline sales managers who need frequent feedback loops to stay motivated.
The risk with quarterly cycles: sandbagging. If managers can influence deal timing (and they often can), shorter cycles incentivize holding deals across periods to smooth attainment. This is the same problem described in the pay for performance guide — the ratchet effect operates at a quarterly level too.
A practical middle ground: annual measurement with quarterly draws against the expected annual payout. Employees receive 25% of estimated target bonus each quarter, then true up (or pay back) at year-end. This gives frequent payment without creating quarterly optimization incentives.
Common STIP design mistakes
Setting the threshold too high. A threshold at 90% of goal means most employees reach it in good years and miss it in bad ones. The design should allow roughly 80–85% of employees to earn something in a reasonable year. If most employees are at zero, the plan stops influencing behavior.
Too many metrics with equal weight. Five metrics each weighted 20% means no single metric drives behavior. Weight your most important metric at 40–50%, then distribute the rest.
No communication until payout time. STIPs fail when employees can't track their own progress. Carvd's rep dashboards show real-time progress against targets — monthly updates like "68% of revenue goal achieved" keep the plan front of mind rather than an abstract number that arrives at year-end.
Changing the goal mid-year. Adjusting targets after the year starts (outside of M&A or major restructuring) destroys trust in the plan. If market conditions change, use discretion at year-end rather than moving the goalposts.
In 2024, the average STIP payout was 89% of target, with about 64% of companies paying below their target amount (per CandorIQ's 2024 compensation data). That means well-designed plans with honest goals — not sandbagged or inflated — typically pay out slightly under target in most years. If your plan consistently pays out at 120% or more, your goals are probably too easy.
How STIP fits with commission tracking
For companies running both commission plans (for reps) and STIPs (for managers and ops staff), the administrative load is real. Commission calculations need to be accurate before any STIP tied to team quota attainment can settle — if you're still reconciling rep payouts, you can't finalize the manager's bonus.
Tools like Carvd calculate rep commissions automatically and generate payroll-ready exports, giving managers real-time visibility into team performance so the STIP numbers aren't held hostage to a spreadsheet reconciliation at period-end.
A well-designed sales compensation plan integrates both layers — the commission structure for individual reps and the STIP for the people managing them — so payouts at every level reflect the same underlying performance data.
For broader context on incentive plan types and how to structure variable pay across your organization, see our related posts: incentive pay, pay for performance, and annual incentive plan design.
Last updated: March 22, 2026